Be AI om en sammanfattning
A solar eclipse diagram can look classroom ready and still teach the wrong lesson if it puts the Moon on the far side of Earth. To make educational infographics with MiniMax H3 Image useful, settle the facts and reading order before asking the model to arrange them. Then treat its image as a draft: check every label, arrow, duration, and scientific relationship against the source. This guide gives teachers and course designers 5 prompts they can copy, plus a fact sheet and a release check. MiniMax H3 Image generates and edits still images. MiniMax H3 also names a video model, which is a different tool. The examples below pair source references with created drafts and copy-ready prompts. The drafts are shown for review; their model provenance and scientific accuracy have not been independently verified here.
Key takeaways
- Pick a layout that matches the knowledge: a cycle, spatial relationship, action sequence, or network.
- Give MiniMax H3 Image approved wording and explicit relationships before asking it to design.
- Check the output at teaching size, including labels, arrows, shadows, and timing.
- If a relationship remains wrong, use the authoritative figure instead of the AI draft.
What MiniMax H3 Image Can Do for Educational Infographics
MiniMax describes its MiniMax H3 Image model as a tool for generating and editing still images from text or references. Its published options include 1K, 2K, and 4K output and up to 16 reference images. Those are production options, not a guarantee that an eclipse shadow or handwashing instruction will be accurate. Short titles and labels are a sensible target; dense paragraphs belong in the slide notes or beside the image. (MiniMax H3 Image model information, November 2026)
A teacher can start from a brief, supply an approved drawing as a reference, and request a change to a label or panel. Give each reference a job. A source diagram can guide geometry; a previous classroom poster can guide color and type. Neither reference substitutes for checking the output. A model may preserve a source's style while shifting a crucial arrow.
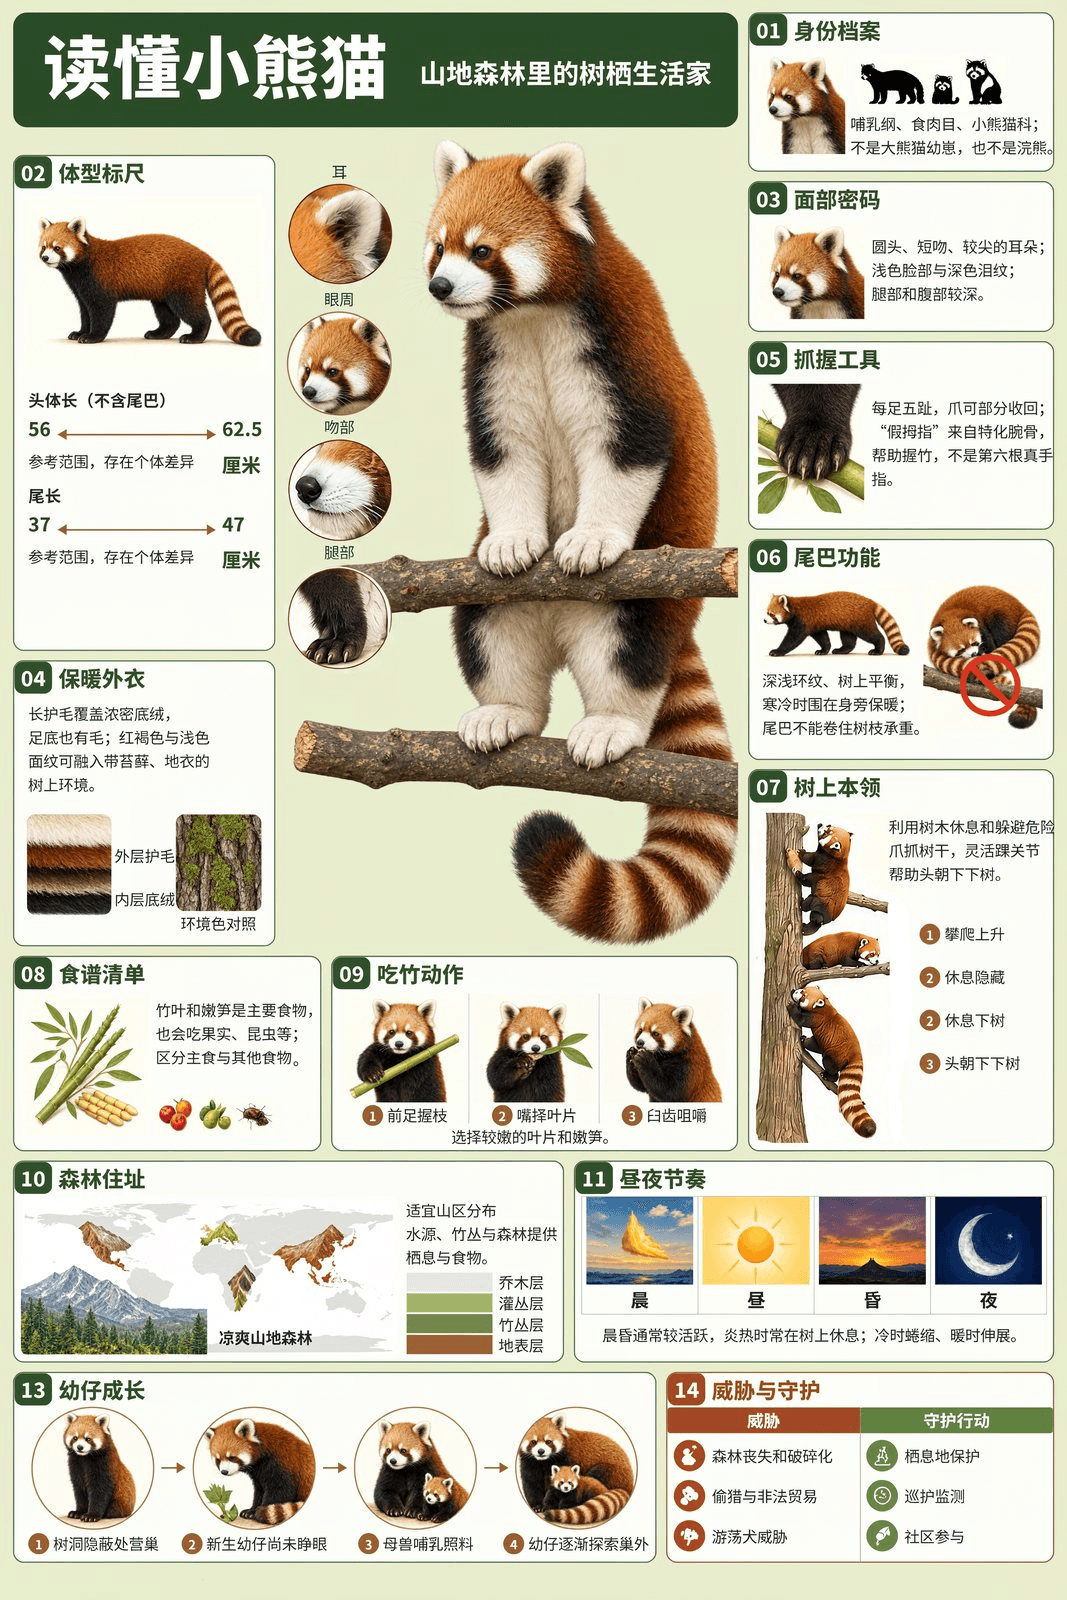
MiniMax's published red panda example shows a dense panel layout. It is an official showcase, not a verified biology reference or a test of the prompts here.
Choose the information structure before choosing colors. A water cycle graphic describes movement among reservoirs. A solar eclipse diagram describes positions and shadow regions at one moment. A handwashing poster describes actions in a fixed order. A Moon phase diagram connects orbital position with appearance from Earth. A food web maps feeding relationships. Their arrows can mean physical flow, light direction, reading order, orbital movement, or energy flow. That distinction should determine the page design.
| Graphic type | Best fit | Relationship to verify | Starting ratio |
|---|---|---|---|
| Process diagram | Water moving through connected stages | Arrow origin, destination, and continuity | 16:9 slide |
| Spatial diagram | Sun, Moon, Earth, and shadow regions | Object order and shadow geometry | 16:9 slide |
| Action poster | Handwashing steps | Panel order, action, and duration | 3:4 poster |
| Orbit and observation diagram | Moon position and appearance from Earth | Phase order and illuminated side | Square classroom graphic |
| Food web | Feeding relationships in one habitat | Arrows point from food to consumer | 16:9 slide |
Use the ratio as a canvas choice, not a scientific rule. A wide slide gives room for a landscape or a line of celestial bodies. A portrait poster lets a child scan larger actions at closer range. A square layout gives an orbit diagram room on all sides. The model's controls may differ by interface, so confirm the offered ratio before rendering. Once the structure is chosen, keep the facts outside the model's imagination.
Start With a Fact Sheet Before Writing the Image Prompt
Write a short fact sheet with 4 fields. The claim says what students should learn. Approved wording is the exact text allowed inside the image. Visual relationship says where an object or arrow must go. Source tells the reviewer where to check it. This document is easier to approve than a finished illustration, and it gives a colleague a clear reason to reject an incorrect draft.
| Claim | Approved wording | Visual relationship | Source |
|---|---|---|---|
| Water returns through several paths | EVAPORATION, TRANSPIRATION, CONDENSATION, PRECIPITATION, INFILTRATION | Vapor rises from water and plants; rain falls; some water enters soil | USGS water cycle teaching graphic |
| A solar eclipse has the Moon between Sun and Earth | SUN, MOON, EARTH, UMBRA, PENUMBRA | Moon's shadow extends toward Earth; umbra is central, penumbra surrounds it | NASA eclipse geometry |
| Washing hands follows 5 actions | WET, LATHER, SCRUB, RINSE, DRY | Panels follow action order; scrubbing lasts at least 20 seconds | CDC handwashing instructions |
| Moon phases reflect viewing geometry | NEW MOON, WAXING CRESCENT, FIRST QUARTER, WAXING GIBBOUS, FULL MOON, WANING GIBBOUS, THIRD QUARTER, WANING CRESCENT | Each Earth-facing appearance matches its orbital position and one sunlight direction | NASA Moon phases diagram |
| A food web shows energy transfer | PHYTOPLANKTON, KRILL, HERRING, MACKEREL, TUNA, SEAL | Each arrow runs from the organism eaten to its consumer | NOAA aquatic food web |
The USGS water cycle graphic includes many processes beyond this lesson's 5 labels. The simplified classroom graphic is a selected teaching view, not a complete inventory of Earth's water system. Its arrows should still represent actual movement. In the sample landscape, evaporation rises from the ocean, transpiration rises from plants, condensation belongs in clouds, precipitation falls, and infiltration moves into soil. Water also returns by surface and groundwater paths, even though the brief limits prominent labels to 5.
For an eclipse, the fact sheet needs more than an object list. NASA explains that a solar eclipse occurs when the Moon passes between Sun and Earth. The Moon casts a smaller central umbra and a broader penumbra toward Earth. If the bodies appear in the right order while the shadow points back toward the Sun, the image teaches the wrong relationship. (NASA eclipse geometry, accessed November 2026)
For handwashing, the approved facts are sequential: wet, lather, scrub, rinse, dry. CDC says to scrub for at least 20 seconds and to lather the backs of the hands, between fingers, and under nails. A poster that correctly prints “20 seconds” beside rinsing has moved the timing to the wrong action. Treat that as a factual error, not a typography issue. (CDC handwashing steps, February 2024)
List exclusions, too. In these examples, ban invented percentages, extra planets, distances, temperatures, and unrequested medical advice. Limit displayed labels, then inspect the output for additions anyway. The fact sheet is an editorial contract for the human reviewer. It cannot force the model to obey perfectly.
5 Copy-Ready MiniMax H3 Image Infographic Prompts
At MiniMax's official image entry, choose MiniMax H3 Image, select the closest offered canvas to each prompt's target shape, and use the highest resolution that fits your workflow. A 4K export gives room to inspect small type, but students see the graphic at slide or print size. Run each prompt separately. If you add a reference image, say whether it guides factual geometry or visual style, then review the actual output before teaching from it.
A Water Cycle Process Diagram
This prompt places every process in a concrete part of one landscape and asks for a clockwise reading order. The arrows do the instructional work. A cloud that points precipitation upward would fail even if every word were spelled correctly. Review the diagram against the USGS source, especially the path into soil and the return path toward surface water.
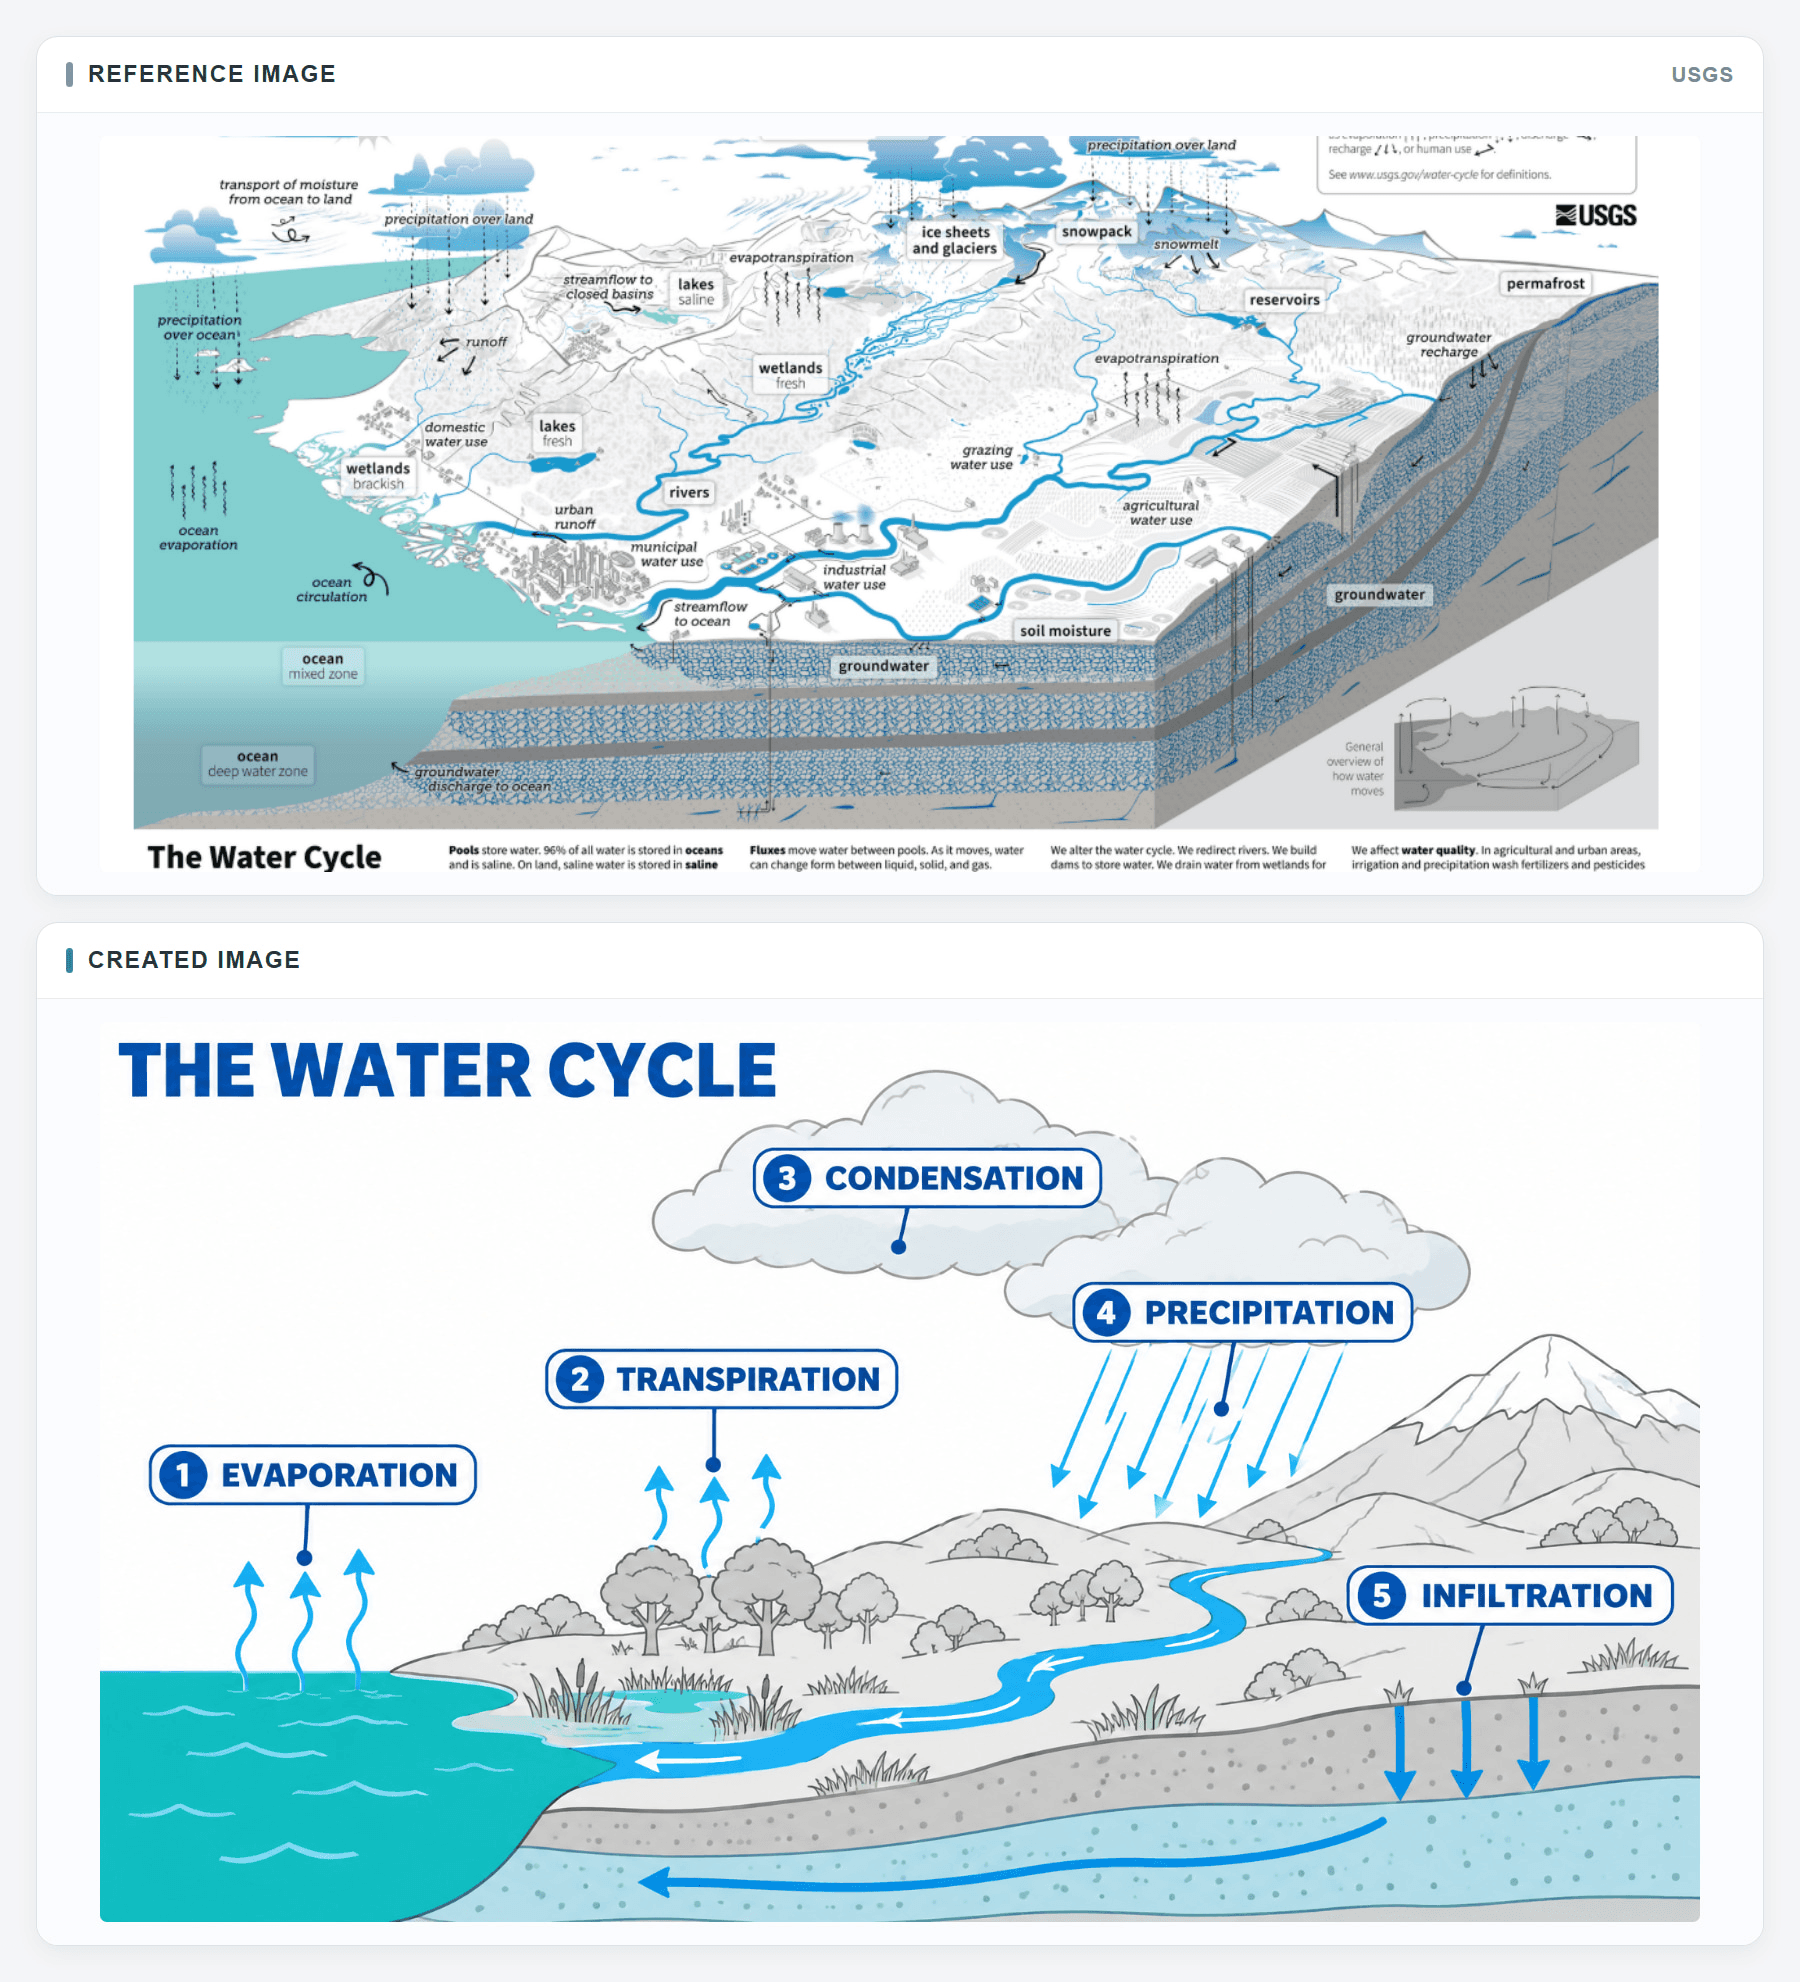
Top: the USGS source reference. Bottom: the created draft. Compare the direction of surface and groundwater paths before classroom use.
plaintext1Create a 16:9 classroom infographic titled "THE WATER CYCLE" for middle-school students. Use the supplied USGS diagram as a reference for its panoramic land-and-water cutaway, restrained scientific linework, pale gray terrain, turquoise ocean, and vivid blue water paths. Redraw an original, simpler teaching graphic; do not copy the USGS logo or fine print. COMPOSITION: Show the ocean across the left foreground, a shoreline with wetlands and a river through the middle, hills and a snowy mountain toward the back right, and a visible soil-and-aquifer cross-section beneath the land. Leave generous white sky above the scene. Use thin gray contour lines for land and only blue or teal for water, vapor, rain, rivers, and underground flow. Keep the surface and underground layers visibly connected. CONTENT: Set exactly five prominent numbered process labels in a clockwise reading path: 1 EVAPORATION above the ocean with small upward vapor arrows; 2 TRANSPIRATION above vegetation with upward vapor arrows; 3 CONDENSATION inside or immediately beside a cloud where vapor gathers; 4 PRECIPITATION below a cloud with rain arrows falling onto land and water; 5 INFILTRATION at the soil surface with arrows continuing downward into the aquifer. The numbers guide the reader; they do not claim that every drop follows one fixed route. Show a blue river returning surface water toward the ocean and a subtle underground water path, without adding extra process labels or a large decorative cycle arrow. DESIGN CHECK: Use crisp typography, short leader lines, enough space between labels, and strong contrast at slide size. Every arrow must start and end in a physically plausible place. Do not add statistics, temperatures, invented reservoirs, extra numbered stages, logos, a photo frame, or a mockup scene. Output the complete flat infographic.
The numbering is a reading aid, not a claim that each water molecule completes these stages in a single fixed sequence. A student should be able to follow one arrow and say where the water goes next. If an arrow bends across a label or seems to originate in a hill rather than water or vegetation, redraw or remove it. Keep longer explanations of runoff and groundwater in the lesson text unless they are part of the approved objective.
A Solar Eclipse Spatial Diagram
The eclipse is a geometry problem. Put Sun, Moon, and Earth on a horizontal line, with the Moon in the middle. Show light moving toward Earth. Label the dark inner umbra and the lighter surrounding penumbra on the Earthward side of the Moon. A reference helps, but a generated shadow must be checked against NASA's actual diagram before it goes into class.
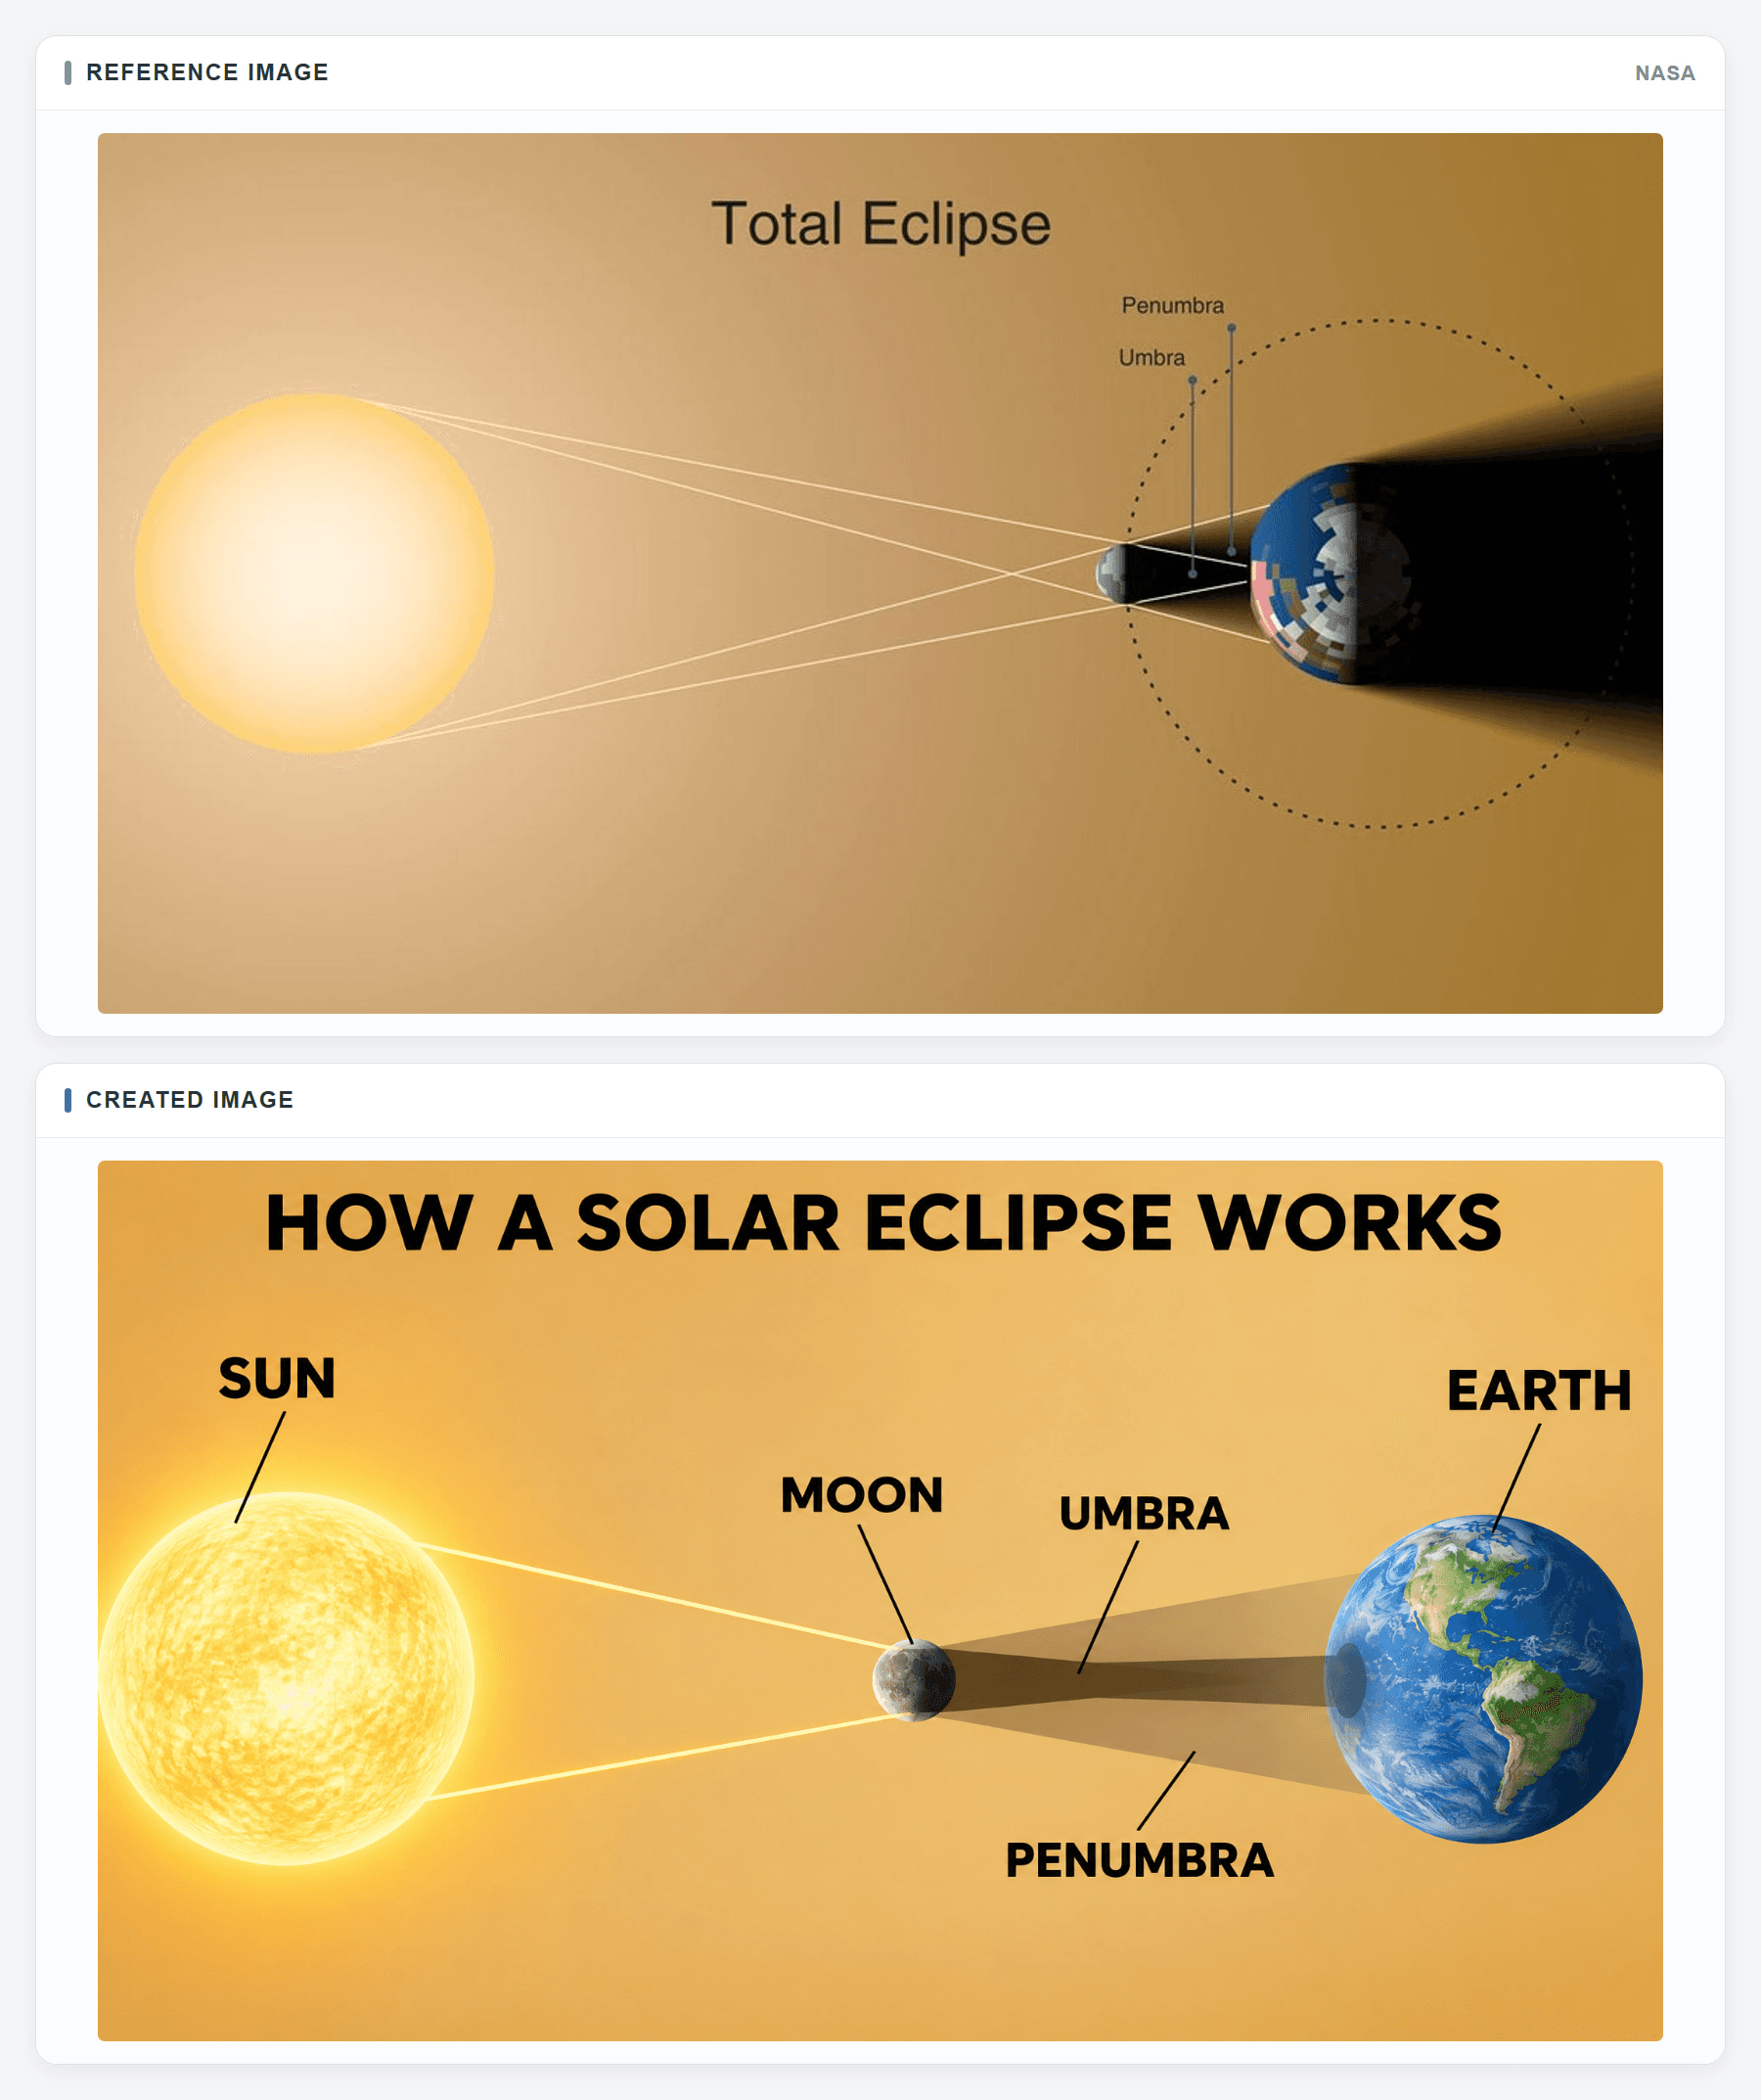
Top: NASA's eclipse geometry reference. Bottom: the created draft. Check object order and the direction of both shadow regions.
plaintext1Create a 16:9 educational diagram titled "HOW A SOLAR ECLIPSE WORKS" for a classroom slide. Use the supplied NASA eclipse graphic as the visual reference: a warm sand-to-gold background, a luminous pale-yellow Sun on the far left, a small dark Moon between the Sun and Earth, a blue Earth on the far right, and clean geometric shadow boundaries. Make an original scientific redraw without agency marks or source text. COMPOSITION: Arrange SUN, MOON, and EARTH on one horizontal axis with clear negative space around each body. Show a few thin, straight light rays traveling left to right from the Sun and skimming the Moon's upper and lower edges. Behind the Moon, draw a narrow, dark central UMBRA that reaches a small area on Earth's day side, surrounded by a broader, translucent PENUMBRA. Use soft shading for the spheres and shadows, but keep the ray and shadow geometry precise and easy to trace. Put small, high-contrast leader labels outside the cones so no text blocks the boundaries. TEXT AND FACTS: Use only the title and these five labels: SUN, MOON, EARTH, UMBRA, PENUMBRA. The Moon must be between Sun and Earth; both shadow regions extend toward Earth, never back toward the Sun. The umbra is the darker inner region and the penumbra is the lighter outer region. The image is schematic, so imply no true size or distance scale. Do not add extra planets, dates, eclipse percentages, ornate rays, a photograph, a UI, or a poster mockup. Output one complete diagram for factual review.
The diagram need not claim to be to scale. A classroom slide often enlarges the Moon so learners can see it. That is acceptable only if the caption or teaching notes avoid implying true distances and relative sizes. Check that the two shadow labels each point to one region. If the model draws a dark cone that never reaches Earth while the title promises a total solar eclipse, the central lesson is broken.
A Five-Step Handwashing Poster
For a younger audience, a portrait poster can give each action more visual space than a dense row of icons. The third panel must connect the action to its duration. CDC's public poster provides a source artifact for the 5-step order; its wording can differ from the chosen short labels, so verify the action rather than identical decoration.
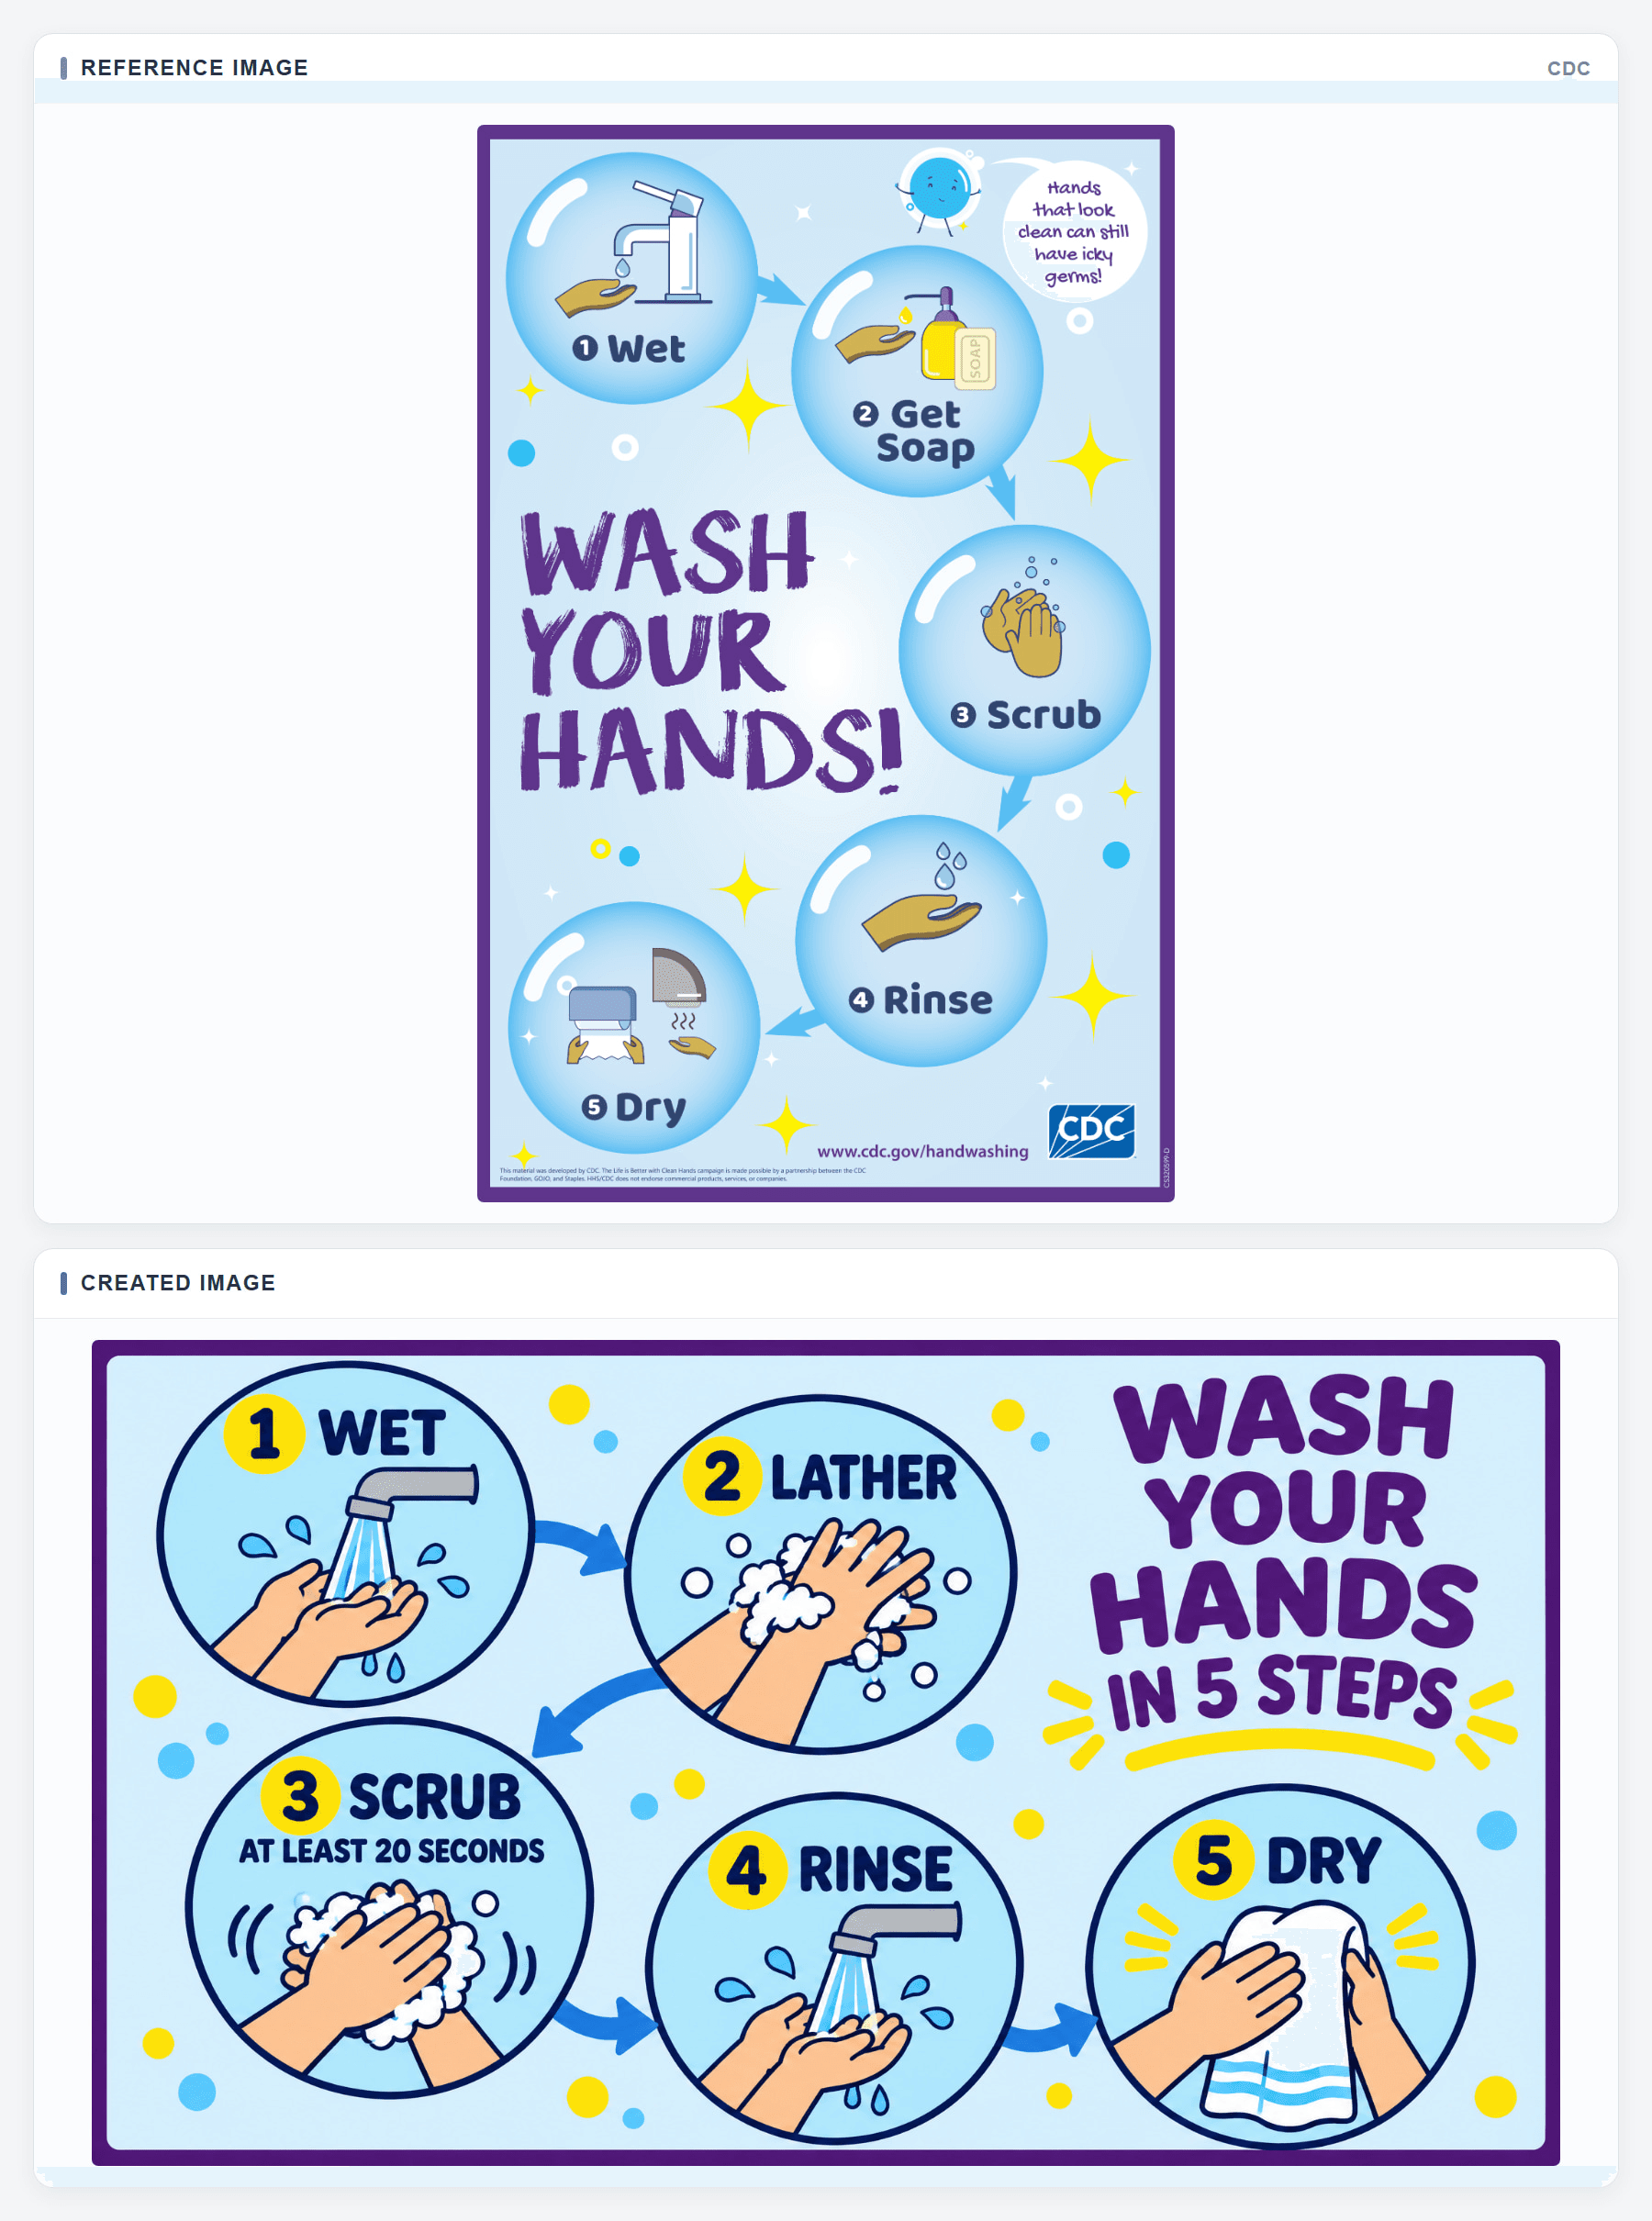
Top: the CDC poster reference. Bottom: the created draft. The five actions should stay in order, with “at least 20 seconds” attached to scrubbing.
plaintext1Create a 3:4 portrait classroom poster titled "WASH YOUR HANDS IN 5 STEPS" for young children. Use the supplied CDC poster as a visual reference for its cheerful pale-blue background, deep-purple outer border, large sky-blue circular step panels, navy outlines, small yellow accents, and simple hand illustrations. Make an original poster without the CDC logo, website address, mascot, speech bubble, or any copied campaign wording. LAYOUT: Place five large circles in a clear zigzag path from upper left to lower right, linked by broad but unobtrusive blue arrows. Give each circle one large step number, one short bold label, and one unmistakable action drawing. Keep an open area for the large purple title without covering a circle. Use consistent hand shapes, soap and faucet symbols, high contrast, and generous margins. Decorative dots may support the playful style, but they must not compete with the steps. EXACT SEQUENCE: 1 WET shows hands under clean running water. 2 LATHER shows soap and lather over the backs of hands and between fingers. 3 SCRUB shows hands rubbing together; place the smaller line "AT LEAST 20 SECONDS" inside this circle directly below SCRUB. 4 RINSE shows hands under running water again. 5 DRY shows a clean towel and dry hands. Make the arrow from each step lead to the next numbered step, never skip a panel. Do not add a sixth step, germ-reduction numbers, medical claims, tiny paragraphs, logos, a wall scene, or a mockup frame. Keep all labels readable at printed poster size and output the finished flat poster.
Read the finished poster in the order a child will scan it. A grid that skips from panel 2 to panel 4 can undo otherwise correct content. Test the poster on an ordinary screen or printed sheet at its intended viewing distance. If the third label shrinks to fit, move its timing into a short line below the action or enlarge the panel in a design tool.
A Moon Phases Orbit and View Diagram
Moon phases need two linked views: where the Moon sits around Earth and what its lit face looks like from Earth. NASA's Moon phases source graphic pairs those views. Give the model one sunlight direction and an explicit phase order so it does not treat Earth's shadow as the cause of ordinary phases.
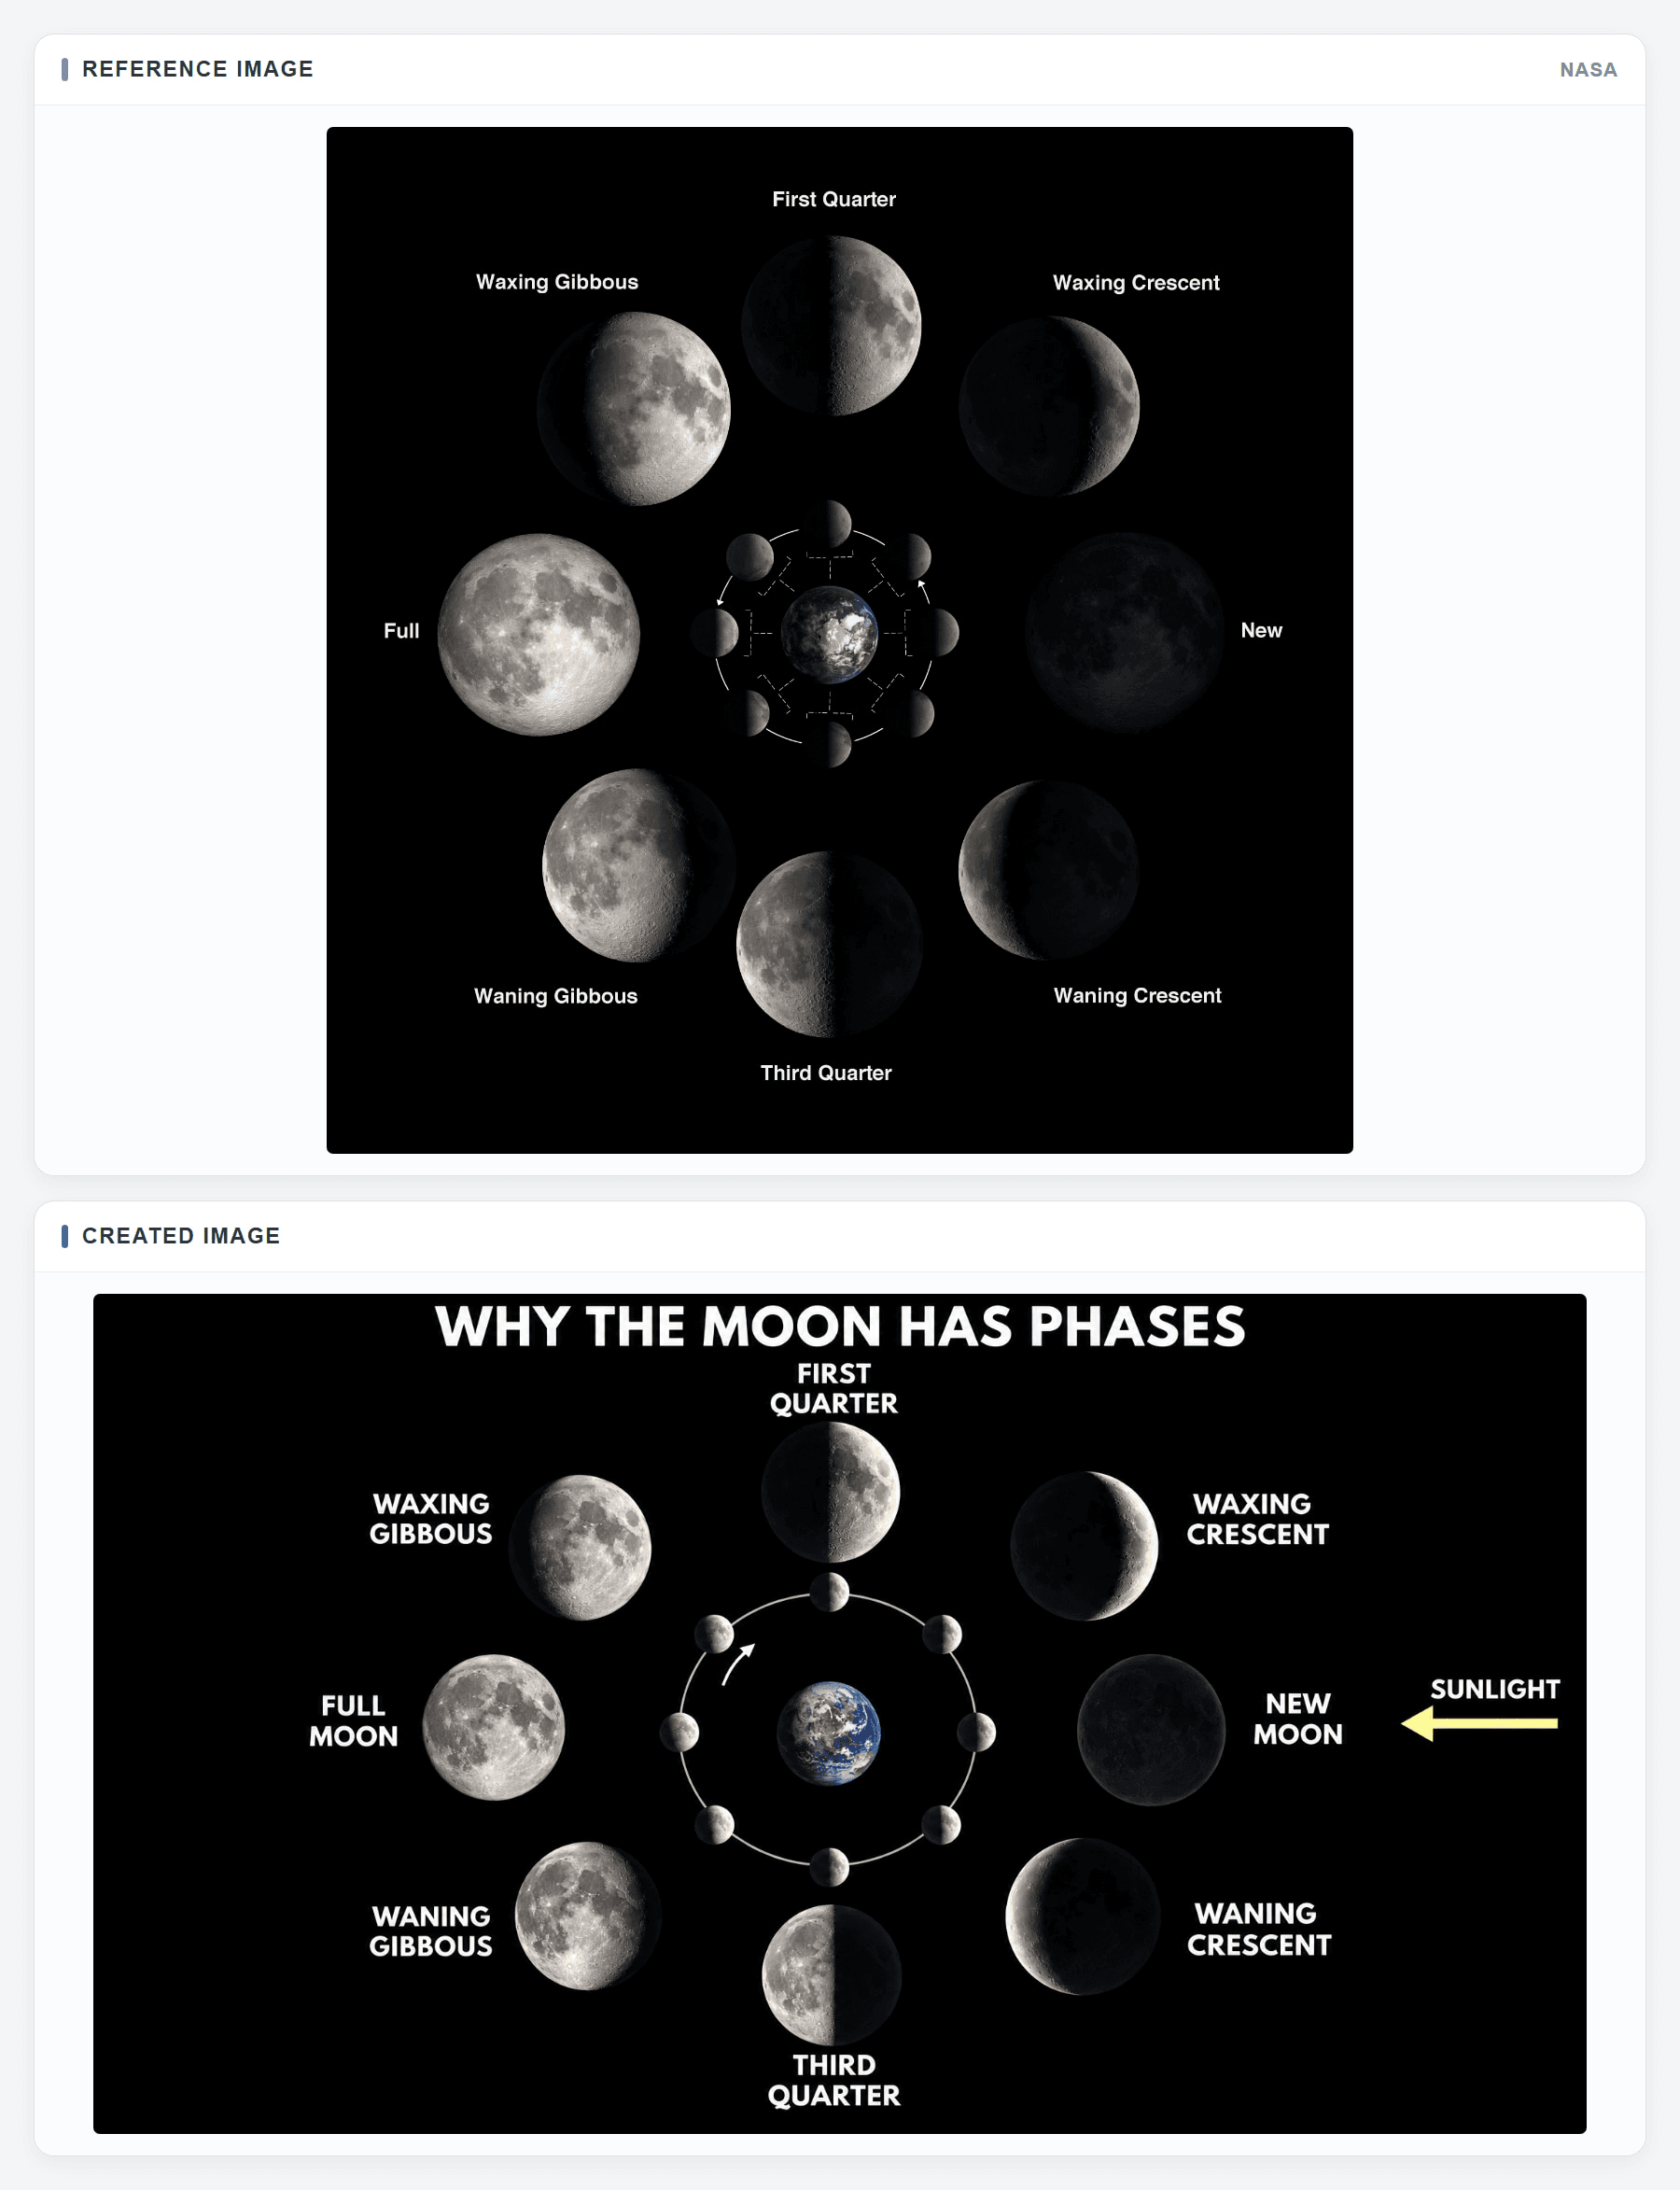
Top: NASA's Moon phases reference. Bottom: the created draft. Match each named phase to its orbital position and Earth-facing appearance.
plaintext1Create a square educational infographic titled "WHY THE MOON HAS PHASES" for middle-school students. Use the supplied NASA Moon phases chart as a reference for its black background, luminous realistic Moon discs, small central Earth-and-orbit view, larger phase portraits around the outside, and simple white labels. Rebuild the diagram as an original, uncluttered scientific illustration without agency branding. COMPOSITION: Put a small Earth at the center. Around it, draw a thin circular orbit with eight small Moon positions as viewed from above Earth's north pole. Incoming sunlight comes consistently from the right; a restrained arrow labeled SUNLIGHT may show that direction. Surround the orbit with eight larger Earth-facing Moon portraits. Connect each inner position to its matching outer portrait by radial alignment, not by crossing connector lines. Use one subtle counterclockwise reading arrow on the inner orbit. Give every portrait similar diameter, realistic lunar texture, and a clear lit-versus-dark boundary. Leave enough black space for bright white phase names. PHASE ORDER: Starting at the right and moving counterclockwise, place NEW MOON at right, WAXING CRESCENT upper right, FIRST QUARTER top, WAXING GIBBOUS upper left, FULL MOON left, WANING GIBBOUS lower left, THIRD QUARTER bottom, and WANING CRESCENT lower right. The lit side of every inner Moon must face the right-hand sunlight. The larger outer view must show the matching phase as seen from Earth: waxing lit on the right, waning lit on the left. New Moon is dark from Earth and Full Moon is bright. Use only the title, the eight phase names, and optional SUNLIGHT label. Do not show Earth's shadow as the cause of ordinary phases, add dates, suggest true scale, add extra phases, or turn the diagram into a night-sky photograph. Output the complete readable infographic, not a mockup.
Check the small orbital Moons against the larger Earth-facing views one pair at a time. New Moon should be near the Sun's direction; Full Moon should be opposite. If a phase name, lit side, or position disagrees with NASA's chart, correct the relationship before using the image in class.
A Marine Food Web Diagram
A food web teaches connections, not a single straight chain. NOAA's aquatic food web reference shows several prey-to-predator paths in a Gulf of Maine example. This prompt selects six organisms and a small set of relationships from that source so a classroom slide remains readable.
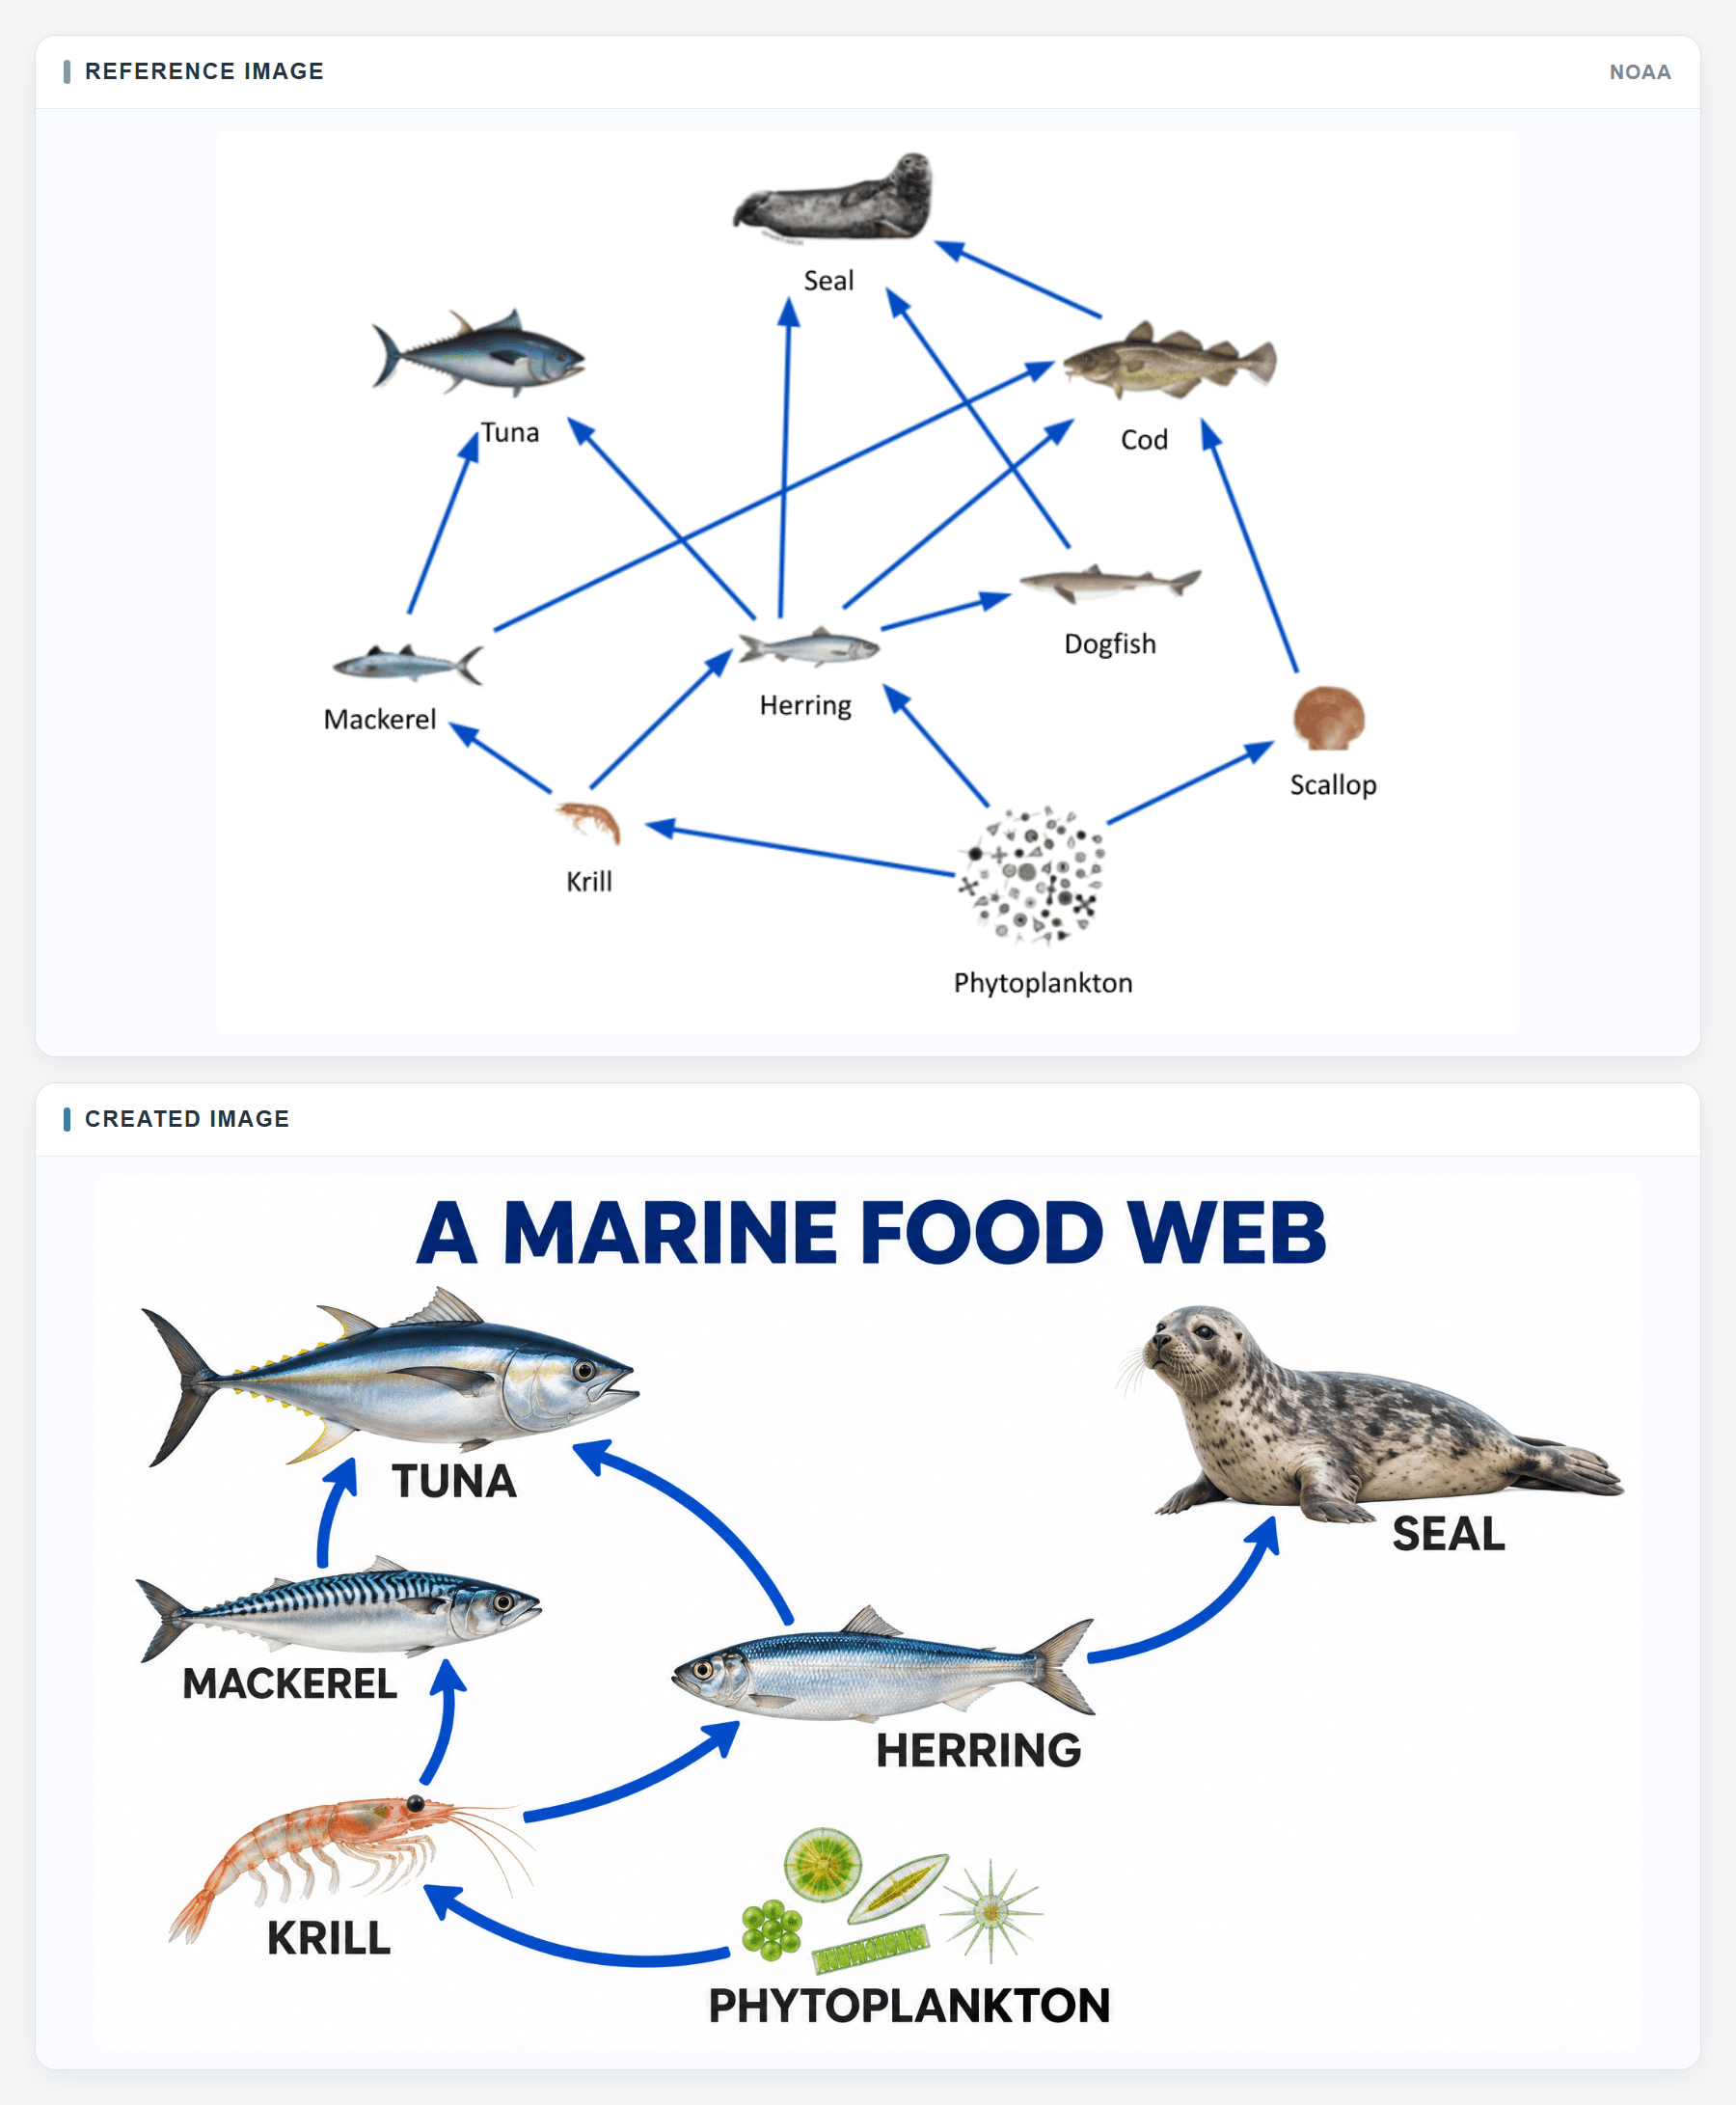
Top: NOAA's food web reference. Bottom: the created six-organism draft. Check each selected arrow from food to consumer.
plaintext1Create a 16:9 educational infographic titled "A MARINE FOOD WEB" for middle-school students. Use the supplied NOAA food-web diagram as a visual reference for its open white background, realistic cutout-style sea-life illustrations, short dark species labels, and strong blue directional arrows. Make a simpler original teaching graphic with six organisms; do not copy the NOAA credit or add a decorative ocean backdrop. COMPOSITION: Place PHYTOPLANKTON at bottom center as a small visible cluster, KRILL at lower left, HERRING at the center, MACKEREL at middle left, TUNA at upper left, and SEAL at upper right. Give each organism enough white space and draw it at a recognizable relative size for the page, without implying biological scale. Use a consistent specimen-illustration treatment, subtle natural colors, and one clear label near each image. Route the arrows around illustrations and words; avoid crowded crossings and keep all arrowheads visible. DRAW EXACTLY SIX BLUE ARROWS: PHYTOPLANKTON to KRILL; KRILL to HERRING; KRILL to MACKEREL; HERRING to TUNA; MACKEREL to TUNA; HERRING to SEAL. An arrow starts at the organism being eaten and points to its consumer, showing energy flow. Arrange the paths as a branching web rather than a single vertical chain. Do not draw arrows from predators back to prey or invent other feeding links. Keep the title and six species labels large enough for a slide. Use no trophic-level percentages, extra animals, decorative arrows, colored boxes, logos, UI elements, or mockup frame. Output one complete, legible infographic.
Trace every arrow from food to consumer, then compare each selected link with the NOAA diagram. A branch to both tuna and seal is useful only when it starts from the correct prey. If arrows cross labels or their arrowheads are ambiguous, move the nodes or simplify the layout before teaching from it.
Fix Labels and Layout Without Changing the Lesson
Start with one observable fault: “PENUMBRA points to the dark central region,” or “the scrub panel says 2 seconds.” State the replacement and name everything that must stay. An edit request that merely asks for “more scientific accuracy” leaves the model free to rearrange the lesson. Make a copy of the approved draft first so you can compare the edit with its starting state.
plaintext1Edit the uploaded educational infographic using the approved reference figure and fact sheet as constraints. This is a precise local correction, not a redesign. ERROR TO FIX: [QUOTE THE EXACT WRONG LABEL, ARROW, SHADOW, NUMBER, OR RELATIONSHIP]. REQUIRED REPLACEMENT: [STATE THE EXACT CORRECT TEXT OR GEOMETRY]. LOCATION: [DESCRIBE THE PANEL, OBJECT, OR REGION TO CHANGE]. SOURCE CHECK: [NAME THE APPROVED SOURCE OR FACT-SHEET ENTRY]. Change only that identified element. Preserve the canvas ratio, crop, title, composition, object positions, illustration treatment, background, colors, lighting, typography hierarchy, label sizes, panel order, and every other word and arrow. If the correction is a label, keep its leader line attached to the right object. If it is an arrow or shadow, keep its origin, destination, and surrounding geometry physically consistent with the source. Do not add new claims, species, steps, numbers, or decorative elements. Return one complete corrected infographic at the original resolution, with no before-and-after frame or mockup.
Compare the edited version side by side with the original and fact sheet. Check the corrected element first, then scan every other label and arrow for unintended changes. If a changed label overlaps a shadow boundary, the repair is incomplete even if its spelling is fixed. Ask a subject reviewer to check the relationship, not only the copy.
When a local edit repeatedly shifts geometry, regenerate from the fact sheet with a simpler composition. For a small text error, it may be faster and safer to cover the generated text in a layout tool and typeset the approved wording yourself. Keep the illustration as a background only if the relationships remain sound. For a precise scientific diagram, an authoritative source figure may be the best final visual. Image editing capability does not promise exact control over geometry.
Check an AI Infographic Before Students See It
A release check should target what the learner will infer. Spellchecking is necessary, yet a correctly spelled label can point to the wrong object. Inspect the image at 100% for defects and again at actual classroom size. Invite a colleague who did not write the prompt to explain the diagram from its arrows alone; their reading exposes ambiguous layout quickly.
| Check | Pass condition | If it fails |
|---|---|---|
| Facts | Every claim matches the approved source | Correct or remove the claim |
| Labels | Each label names one visible object or region | Move or replace the label |
| Arrows and shadows | Direction and destination match the taught relationship | Redraw, regenerate, or use a source figure |
| Numbers and units | Scrub says at least 20 seconds; no invented values appear | Fix text and recheck the panel |
| Reading order | A student can follow every step without guessing | Reorder panels or simplify layout |
| Legibility and disclosure | Text survives real display size; caption identifies source and review status | Enlarge text and add an honest caption |
For the eclipse, confirm that the Moon lies between Sun and Earth and that its shadow extends toward Earth. Distinguish the narrow umbra from the wider penumbra. For the water cycle, follow the path from evaporation into the atmosphere, through cloud formation and precipitation, and down into soil. For handwashing, read all 5 actions and locate “at least 20 seconds” specifically on scrubbing.
Record what the human actually checked. “AI-generated draft; labels and geometry reviewed against NASA” is useful only after that review happened. If no subject reviewer is available, leave the result as a draft or teach from the NASA, USGS, or CDC source visual. A clean output panel proves that an image was produced. It does not prove that the lesson is correct.
Where to Make and Export the Graphic
MiniMax's image tool is the direct place to try MiniMax H3 Image. Confirm the selected model, available ratio, export resolution, file type, and current price in your account before running it. Export a PNG when labels need close review. Keep the fact sheet beside the export so a future editor can see which statements were approved.
Atlas Cloud lists GPT Image 2.6 Sunburst as a hosted image model. GPT Image 2.6 Sunburst is separate from MiniMax H3 Image, so check the current Atlas Cloud catalog if you specifically need MiniMax H3 Image. If you use GPT Image 2.6 Sunburst as an alternative, paste the same water cycle prompt there, choose a supported wide canvas and quality setting, and audit the output against the same USGS facts. Label the graphic with the model that actually produced it. The model page shows a starting price; quality settings can change the final charge, so check the quote before submitting.
For your next lesson, choose one of the 5 prompt structures, complete the 4-field fact sheet, and render one draft. The value of an educational infographic made with MiniMax H3 Image depends on that final comparison between the image and the approved lesson, especially when one wrong arrow could change what students learn.
Frequently Asked Questions
Can MiniMax H3 Image make a classroom-ready infographic in one pass?
It can produce a still-image draft, but the draft needs a human review before students see it. Check each label, arrow, number, and visual relationship against an approved source at the size students will actually view.
What should I put in an educational infographic prompt?
Start with the lesson's claim, exact approved labels, required positions or sequence, and the source used to verify them. Then specify the audience, canvas, reading order, and what the model must leave out. Keep long explanations outside the graphic.
How do I check a generated water cycle diagram?
Follow each arrow from its origin to its destination. Evaporation should rise from water, precipitation should fall from clouds, and water entering soil should connect to a plausible return path. Compare the draft with the USGS source rather than judging it by appearance alone.
What makes a solar eclipse diagram scientifically wrong?
The Moon must sit between the Sun and Earth, and its shadow must extend toward Earth. The darker umbra belongs inside the broader penumbra. A diagram with correct words but reversed light or shadow direction still teaches the wrong relationship.
Where should the 20-second instruction go on a handwashing poster?
Place “at least 20 seconds” with the scrubbing action, not rinsing or drying. Keep the five actions in order: wet, lather, scrub, rinse, and dry. If that instruction becomes too small to read, enlarge the scrub panel or set the timing as a short line beneath it.


