Data-Analysis-Agent is useful because it turns a data question into a traceable workflow, not just a chart.
This tutorial shows how to run the project with AtlasCloud as the API source, connect a file or database, and reproduce a full natural-language → SQL → chart → business insight workflow.
What Data-Analysis-Agent does?
Data-Analysis-Agent is a conversational business data analysis system. You upload an Excel or CSV file, or connect a database, then ask questions in natural language. The system is designed to understand the question, analyze the schema, generate SQL, execute the query, recommend a chart, and output business insights.
For developers, the interesting part is that the workflow is visible. The README shows an SSE streaming process with steps like reading the data structure, generating SQL, executing the query, then generating the chart and insights.
That makes it easier to debug than a black-box answer box.
The project supports file uploads for Excel and CSV, plus database connections for SQLite, MySQL, PostgreSQL, and SQL Server. DuckDB and Spark are listed as planned. It also includes chart recommendation across six major chart categories, covering comparison, time series, distribution, geospatial, relationship, and part-to-whole visualizations.
Why Data-Analysis-Agent matters?
Most teams have the same annoying pattern.
A business teammate asks, "Can you quickly check the revenue trend for the last quarter?" Then the "quick" task becomes a chain of small chores: find the right table, inspect columns, write SQL, fix errors, export the result, build a chart, and explain what changed.
Not glamorous. Still expensive.
Data-Analysis-Agent tries to compress that workflow into a local chat-style interface. The user asks the question in plain language. The agent handles the query-and-chart path. The developer still needs to verify the output, but the repetitive setup work gets lighter.
This is also why GitHub’s 2026 article about its internal data analytics agent is relevant. GitHub wrote that self-serve data access is hard because teams still need to know which data model, which grain, which filter, and how to write and validate the query. Their internal Qubot design uses a user interface, context layer, and query engine to support plain-language analytics questions.
The same broader lesson applies here: a useful data agent is not only an LLM prompt. It needs data context, query execution, and a visible workflow.
Step-by-Step: Run Data-Analysis-Agent with Atlas Cloud
Before you install it
You need:
- Python 3.10 or higher.
- A local machine running Windows, macOS, or Linux.
- A test Excel/CSV file, or access to a local/test database.
- A browser to open the local app.
The project README lists Python 3.10+ as a prerequisite for the Windows installer and the cross-platform ZIP option. It also says the local browser interface opens at http://localhost:5001 after startup.
Step 1: Get an Atlas Cloud API key
Go to the Atlas Cloud console, open the API Keys page, click Create API Key, then copy and store the key securely.
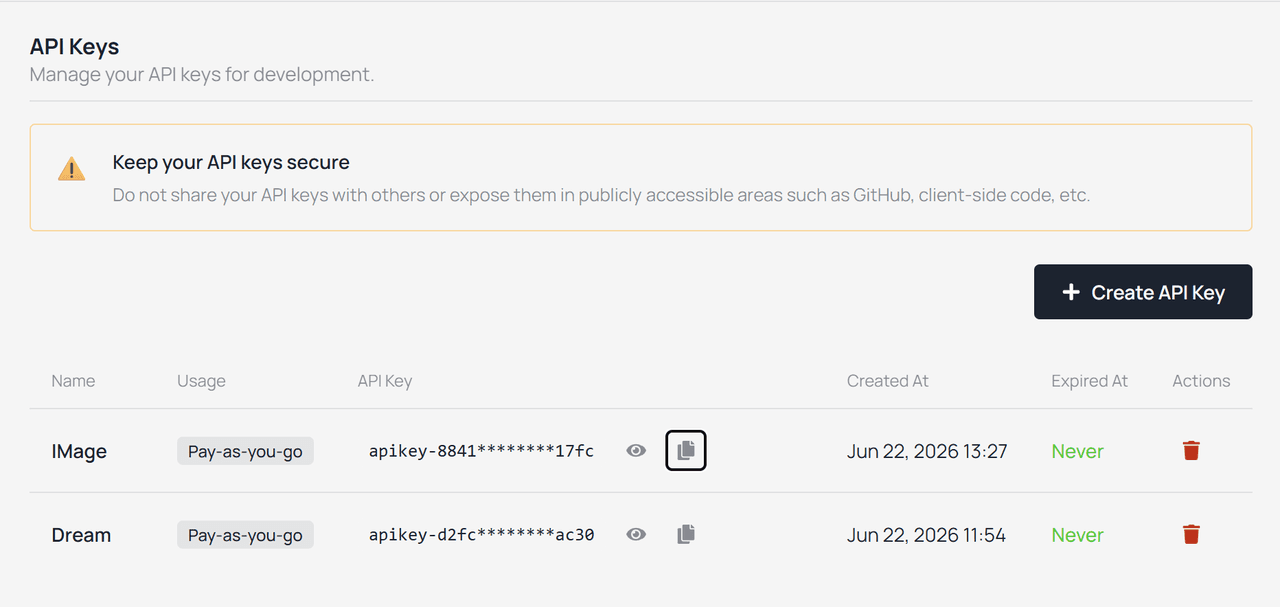
Keep the key private. Do not paste it into a public GitHub repo, public article draft, or screenshot.
Step 2: Install Data-Analysis-Agent
You have several installation options. Here is one option recommended for beginners.
- Download and unzip
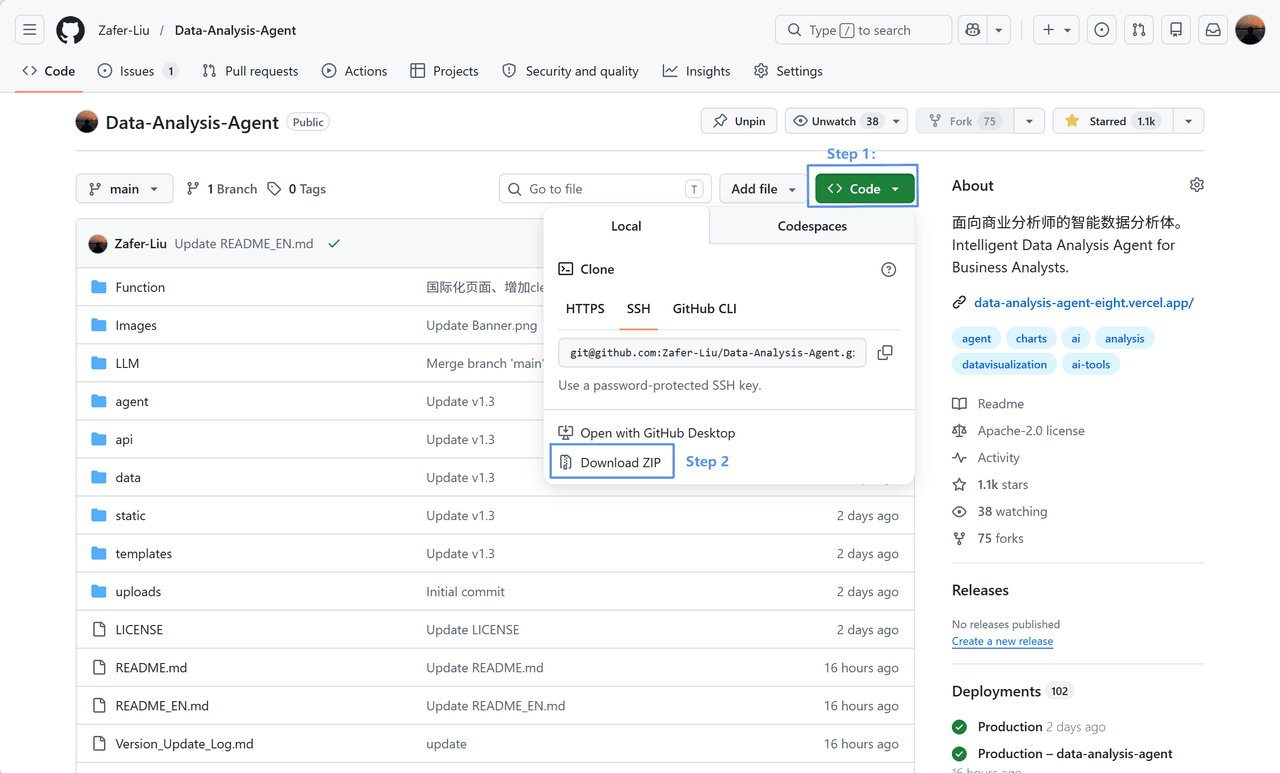
- Double-click to start
On Windows
Extract the package and double-click start.bat
On macOS
Open the terminal,
Run in the terminal (replace the path with the actual extraction location):
This content is only supported in a Lark Docs
Then double-click start.command
The first launch automatically creates a virtual environment and installs dependencies. This usually takes about 3–5 minutes, and later launches are instant.
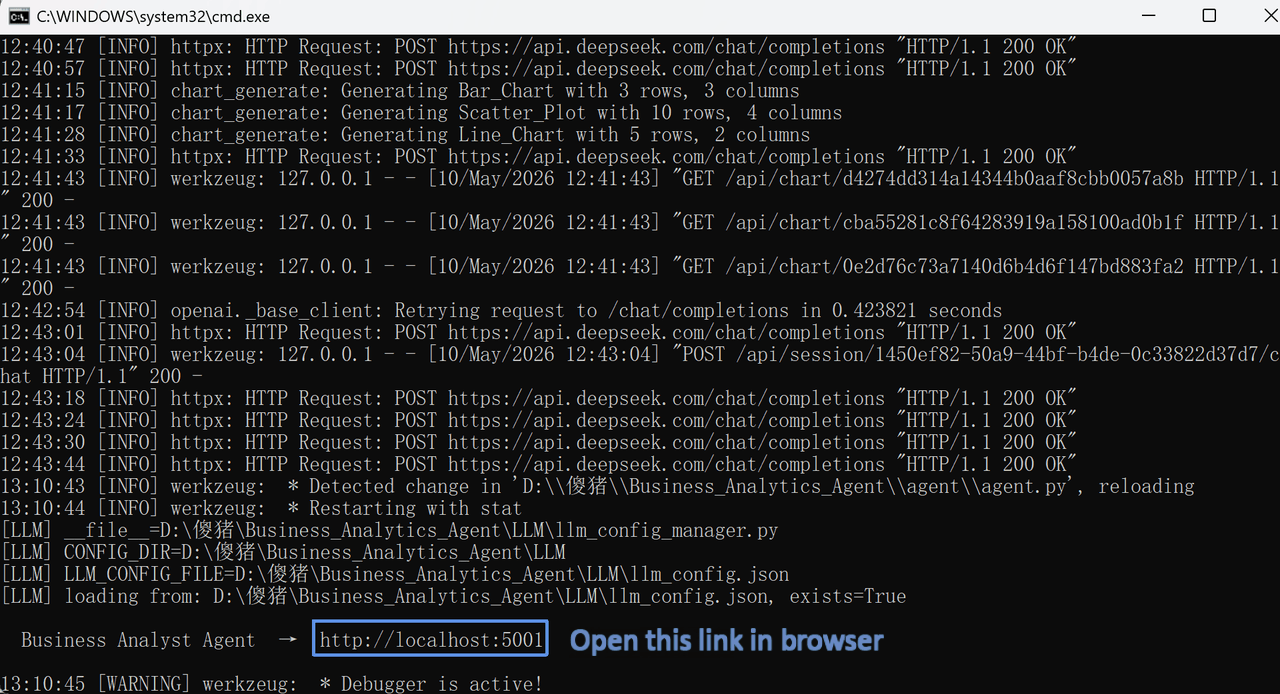
After startup, the browser will automatically open http://localhost:5001
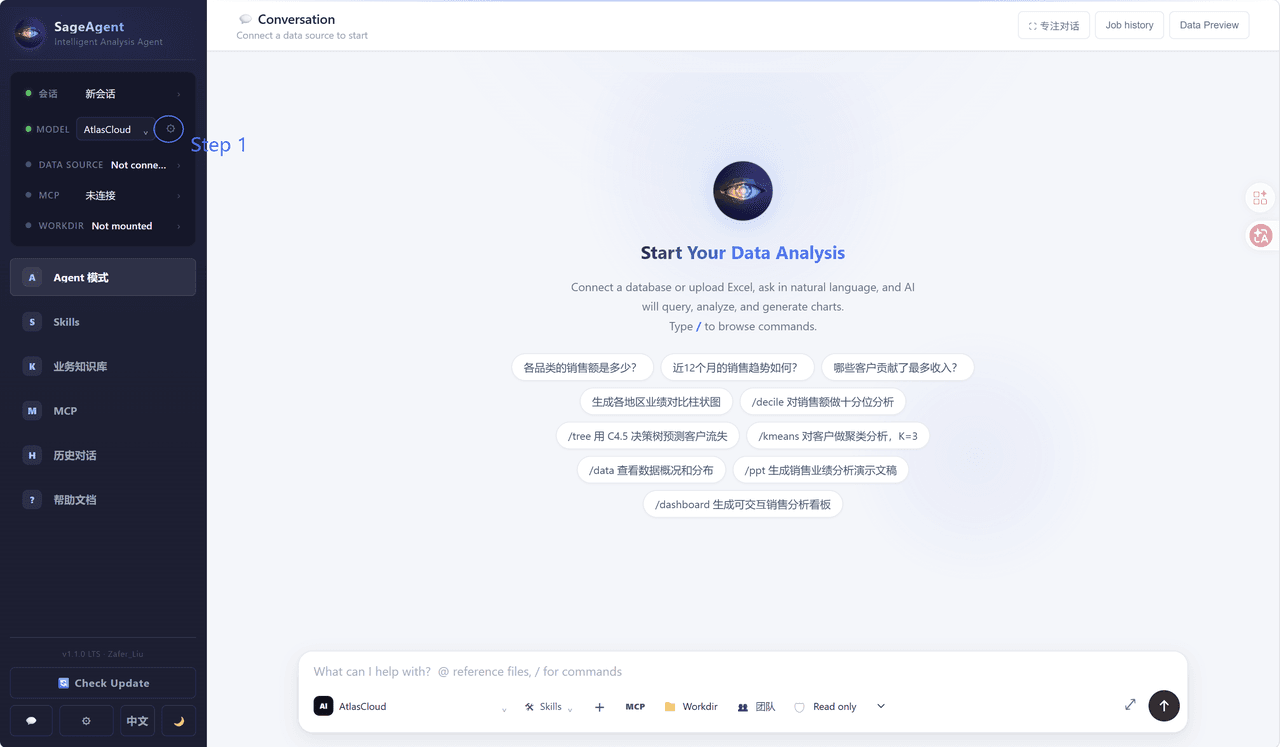
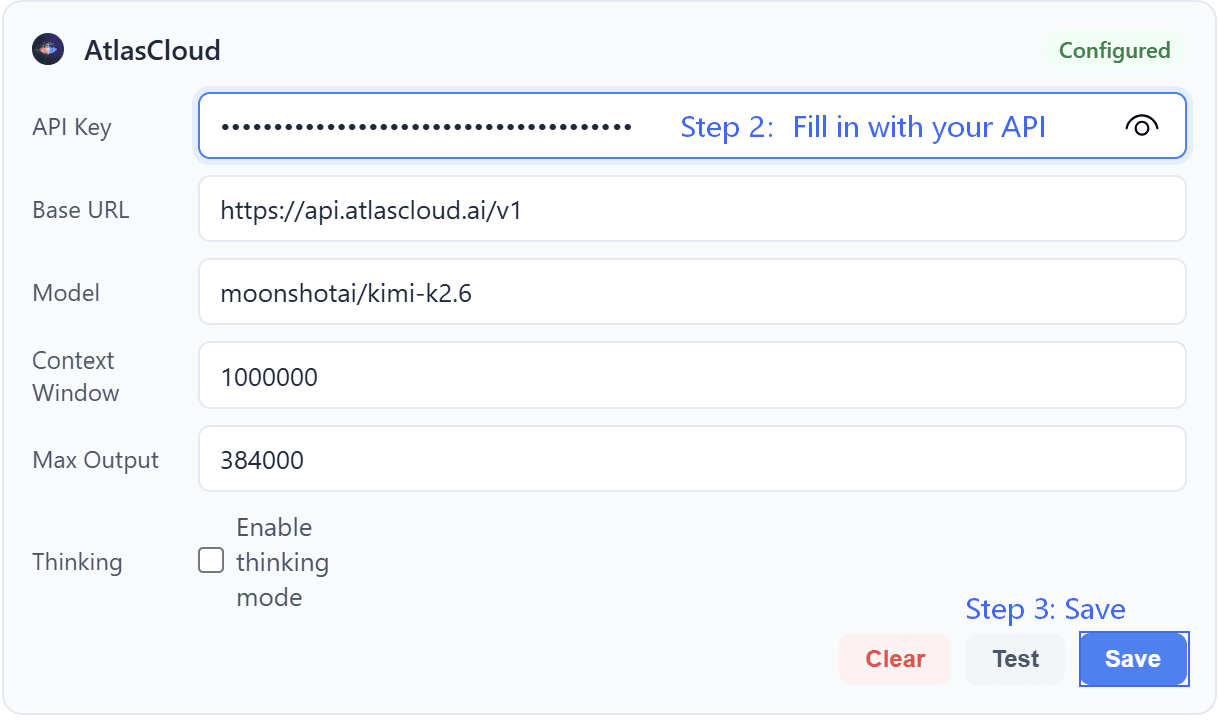
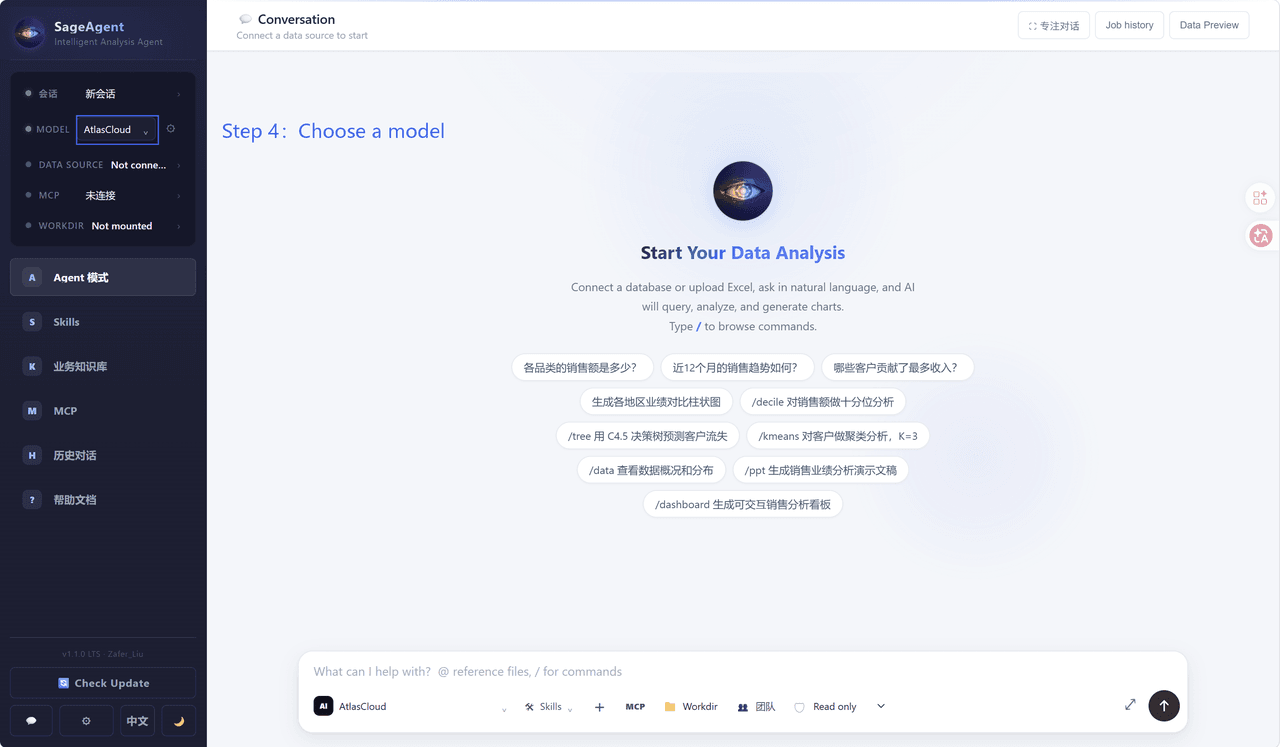
Step 3: Configure the model API
Step 4: Prepare a reproducible test dataset
Use a small sales CSV. You can create a file named:
This content is only supported in a Lark Docs
Use these columns:
This content is only supported in a Lark Docs
A simple example:
This content is only supported in a Lark Docs
Upload it through the web UI.
This dataset is intentionally small. The point is not to prove statistical depth. The point is to verify the full loop.
Step 5: Showcase
This content is only supported in a Lark Docs
Compare the manual workflow with the Agent workflow
This is not a competitor table. It is a workflow table.
This content is only supported in a Lark Docs
The export functions are not just wishful thinking. The README lists formatted Excel spreadsheets, .docx reports, and built-in styled PowerPoint presentations under report generation.
FAQs
Can I chat with CSV or Excel files without writing SQL?
Yes, Data-Analysis-Agent is designed for “chat with CSV” and “chat with Excel” use cases without requiring users to write SQL manually. After a file is uploaded, the system can read the data structure, generate SQL, query the data, recommend a chart, and summarize the result in plain language.
Can Data-Analysis-Agent connect to MySQL, PostgreSQL, or SQL Server?
Yes, Data-Analysis-Agent can connect to several common SQL databases. The README lists SQLite, MySQL, PostgreSQL, and SQL Server as supported database sources, making it useful for developers who want an AI business intelligence agent connected to real structured data rather than only uploaded spreadsheets.
Does this AI data analysis agent generate charts automatically?
Yes, the project can recommend and generate charts automatically based on query results. Its chart system covers six major categories, including comparison charts, time-series charts, distribution charts, geospatial charts, relationship charts, and part-to-whole charts.
Can I export AI-generated analysis reports to Excel, Word, or PowerPoint?
Yes, Data-Analysis-Agent supports report export for common business formats. The project README lists formatted Excel spreadsheets, .docx reports, and built-in styled PowerPoint presentations as supported export options, which is useful when turning an AI analysis session into a shareable report.
What API settings do I need to run Data-Analysis-Agent with an OpenAI-compatible model?
You need an API key, a Base URL, and a model name. Data-Analysis-Agent supports custom base_url, model, and api_key, including OpenAI SDK-compatible APIs; for AtlasCloud, the LLM Base URL is https://api.atlascloud.ai/v1, and the /v1 suffix is required.
Is Data-Analysis-Agent free for commercial use?
No, you should not assume it is free for commercial use. The project README says the software is licensed under CC BY-NC 4.0 and that unauthorized commercial use is prohibited, so commercial users should contact the author for separate licensing.
Can an AI data analysis agent replace a BI dashboard?
No, an AI data analysis agent is better for exploratory questions than for replacing governed BI dashboards. Use Data-Analysis-Agent for fast natural-language analysis, SQL exploration, chart drafts, and temporary business questions; keep official dashboards for stable metrics, permissions, scheduled reporting, and executive-facing KPIs.
What should I check before trusting AI-generated SQL or business insights?
Always review the generated SQL, chart logic, and metric definitions before using the result for decisions. Even when the workflow is visible, an AI data analysis agent can still choose the wrong grouping, misunderstand a column, or produce a plausible explanation that goes beyond the dataset.
Conclusion
The best way to understand Data-Analysis-Agent is not “AI that draws charts.”
A better description is: an open-source workflow that connects natural-language questions to schema reading, SQL generation, query execution, chart recommendation, and business explanation.
That makes it useful for developers who keep getting pulled into temporary data requests. You still need to review the SQL. You still need to protect sensitive data. You still need to define business metrics clearly.
But once the setup works, the boring loop gets shorter: ask, inspect, chart, explain.
That is the part worth trying.





