Two teams can report hundreds of tokens per second for DeepSeek V4.1 Flash and still be measuring different things. One may mean decode speed for a single request; another may mean aggregate output across dozens of concurrent requests. To improve DeepSeek V4.1 Flash inference throughput optimization, first choose the metric your service needs, then benchmark your own request mix, change one serving variable at a time, and verify latency, quality, and cost together. The model family now includes the October 17 Flash-1017 update, so record the exact checkpoint before comparing results. Public reports show useful optimization paths, but none is a substitute for a matched test on your hardware.
Key takeaways
- Aggregate output tokens/s measures capacity across requests; per-request decode speed measures an individual user's experience.
- Reproduce your prompt lengths, output limits, concurrency, warm state, and latency objective before tuning.
- V4.1 Flash's compressed KV cache and bounded replay reduce memory pressure, but do not guarantee a fixed end-to-end speedup.
- Compare vLLM and SGLang only under matched model, hardware, workload, and measurement conditions.
What Does Throughput Mean for DeepSeek V4.1 Flash?
Throughput is a rate, but the numerator and test boundary matter. For an inference service, record at least five measurements:
| Metric | What it tells you | Typical use |
|---|---|---|
| Aggregate output tokens/s | Output tokens produced by all active requests per second | Capacity planning and fleet efficiency |
| Per-request decode tokens/s | Generation speed experienced by an individual request | Interactive responsiveness during generation |
| Prefill tokens/s | Input tokens processed per second | Long prompts and retrieval-heavy workloads |
| Time to first token (TTFT) | Time from request arrival to first output token | Perceived start-up delay |
| End-to-end latency, p50/p95 | Total request duration across the traffic distribution | Service-level objectives and tail behavior |
A server can raise aggregate throughput by batching more sequences while making each user wait longer between tokens. Conversely, a setup tuned for low concurrency may deliver snappy individual responses while leaving accelerators underused. Neither result is universally better. The right target is a point on the throughput-latency curve that meets your product's service objective.
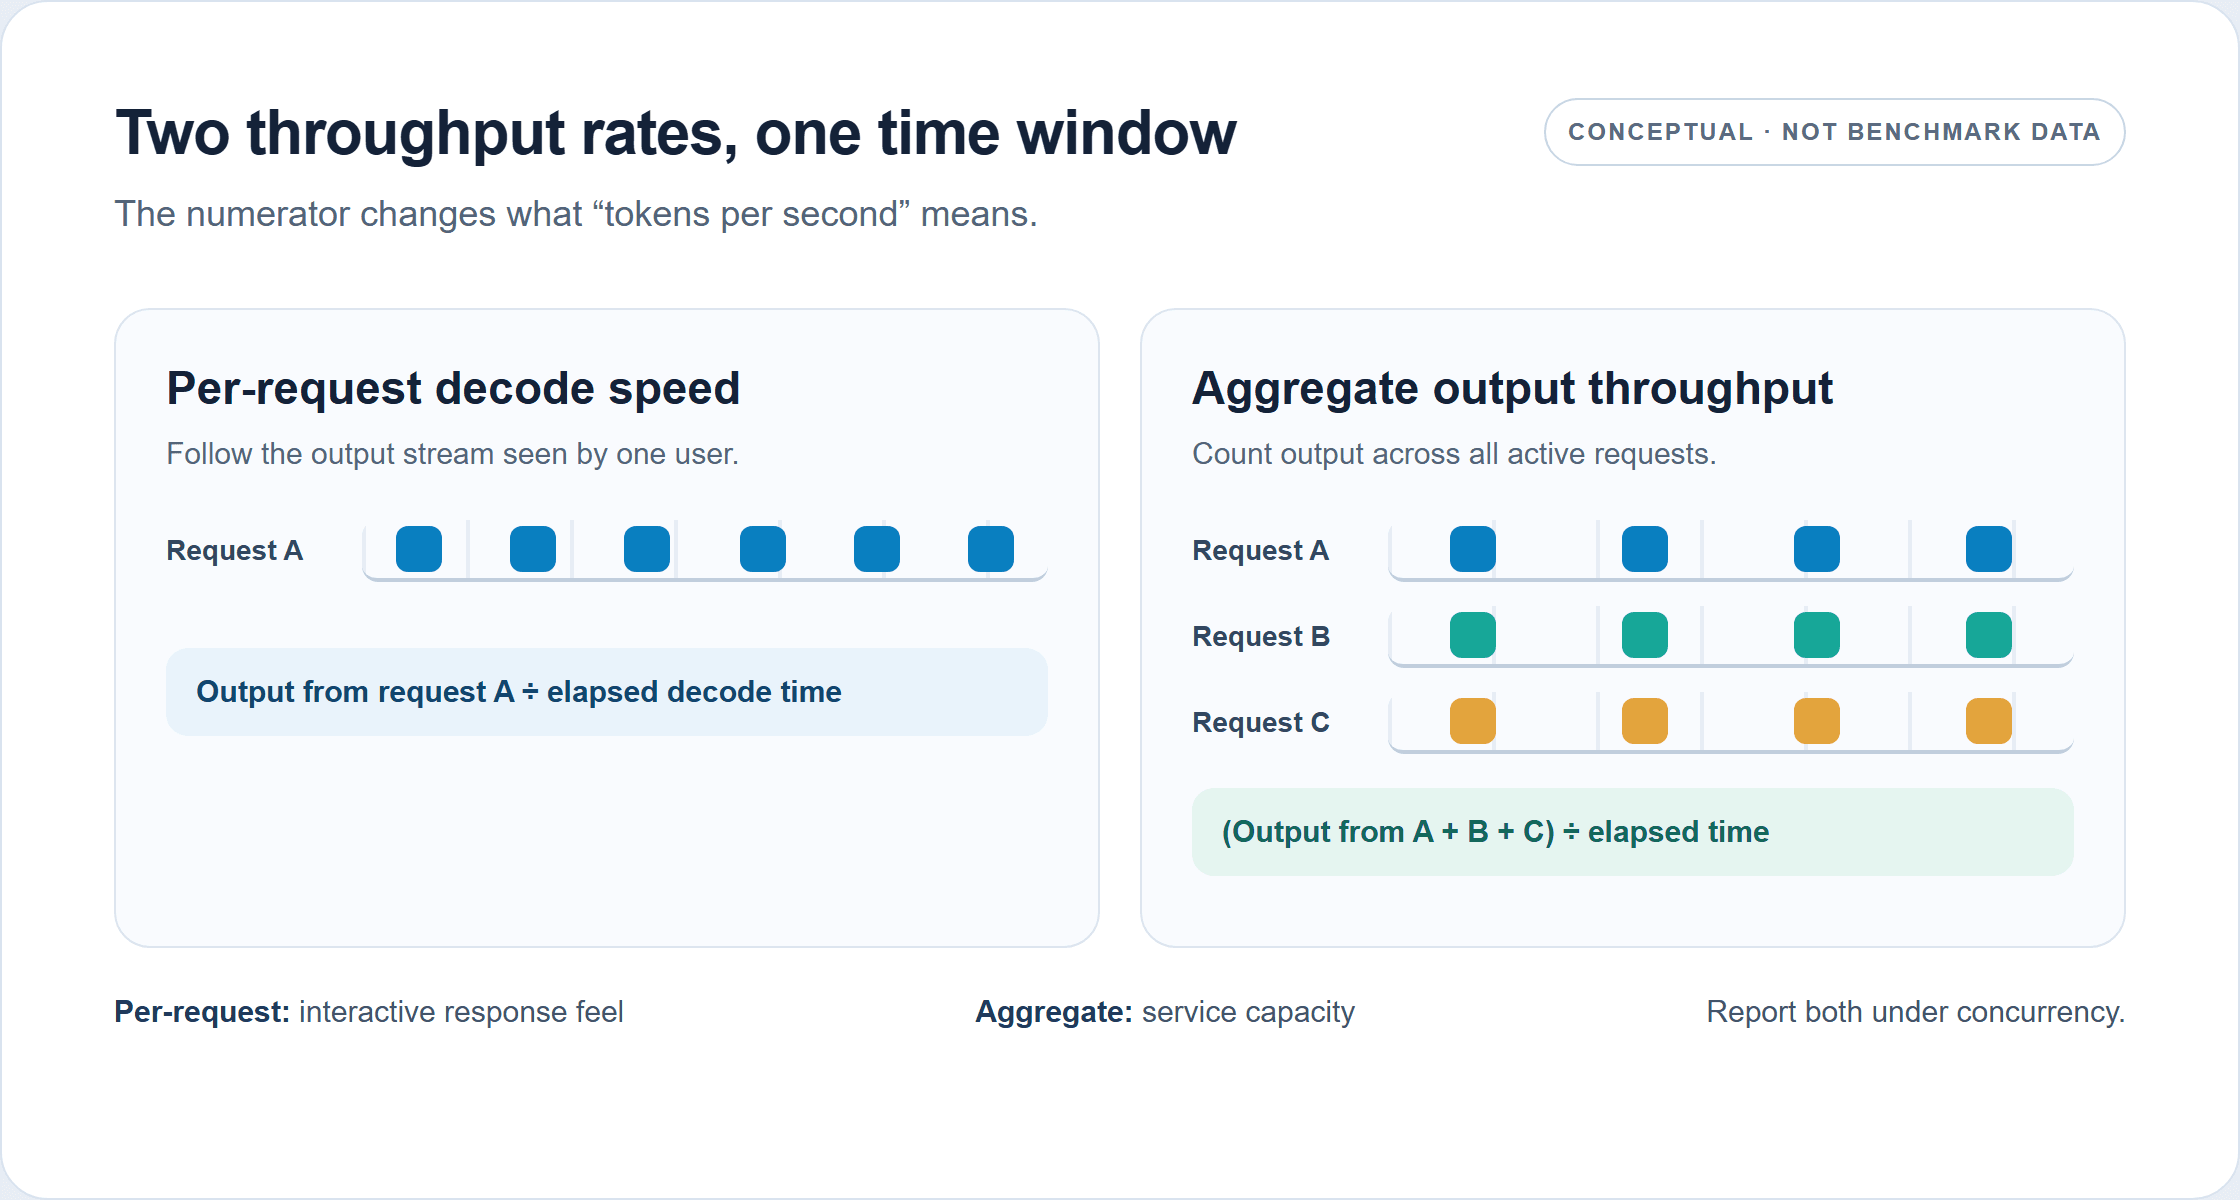
The two rates count different output streams. This is a conceptual diagram, not measured DeepSeek V4.1 Flash performance.
Specify whether throughput includes prefill, decode, or both. State whether you divide by GPU count. Report successful output tokens rather than requested maximum tokens, and disclose cancellations or errors. Without those details, a tokens/s figure cannot tell an operator whether it predicts their application.
Build a Reproducible DeepSeek V4.1 Flash Baseline
A useful baseline resembles production traffic closely enough to expose its bottleneck. A single short prompt is a poor proxy for an agent that repeatedly sends a large conversation history, and a fixed 1,024-token output misses workloads that stop early or vary widely.
Fix the workload and measurement window
Create request buckets from observed traffic. For each bucket, preserve approximate input length, expected output length, arrival pattern, and any shared prefixes. Include tool or reasoning turns if they form part of the real request path. Keep prompts, sampling settings, stop conditions, and output caps fixed between runs.
Run both a low-concurrency case and the concurrency your service expects at peak. Then add intermediate concurrency levels to reveal where throughput stops rising or latency crosses its limit. Use a steady measurement window after warm-up, repeat each point, and report the median plus the range. A short burst may measure startup behavior rather than stable service capacity.
Separate cold-start measurements from warm serving. Cold runs include model loading, graph capture, or cache population depending on the stack; warm runs describe a system that is ready to serve. For a prefix-caching workload, measure cache-hit and cache-miss traffic separately. Do not combine them into one average unless the mix matches production.
Keep a benchmark record
Save a row for each run with these fields: checkpoint or model revision; runtime and commit; GPU model and count; interconnect; precision and quantization; tensor, expert, or pipeline parallel layout; input and output token distribution; concurrency and request arrival pattern; warm or cold state; run duration; success rate; aggregate throughput; per-request decode speed; TTFT; and p50/p95 end-to-end latency.
This record is more useful than a leaderboard number because it makes the next experiment reproducible. Freeze it before tuning. If the workload or checkpoint changes, start a new baseline rather than attributing the difference to a serving flag.
Diagnose Prefill, Decode, KV Cache, or Scheduling
Use symptoms to pick the next measurement, not to guess at a fix. High TTFT with acceptable decode speed points toward input processing, queueing, cache misses, or startup overhead. Slow decode at low concurrency suggests examining kernels, memory bandwidth, parallel communication, and the model's execution path. Aggregate throughput that plateaus as concurrency rises can indicate memory pressure, scheduler limits, communication overhead, or a saturated compute path. Long-context degradation calls for measuring cache residency, prefill work, and host-to-device movement.
| Observation | First checks |
|---|---|
| TTFT grows with prompt length | Prefill rate, queue time, prefix-cache hit rate, graph or compilation warm-up |
| Decode speed is low even at concurrency 1 | Runtime model path, kernel support, precision, GPU utilization, communication overhead |
| Aggregate tokens/s plateaus as concurrency rises | KV-cache capacity, scheduler batching, memory bandwidth, parallel topology |
| p95 latency rises sharply while aggregate output improves | Batch size, queueing policy, request length mix, service objective |
| Long prompts evict useful active requests | KV-cache residency, cache allocation, context distribution, host-memory traffic |
V4.1 Flash has architectural features intended to ease some of these pressures. The model report describes CSA2 with cross-layer cache reuse and FP4 global KV caching, giving a reported global KV footprint of 890 bytes per token, roughly one quarter of V4-Flash's corresponding footprint. SWA Bounded Replay addresses a different storage trade-off: rather than persist all sliding-window attention state, a deployment can reconstruct missing state by replaying the recent window. DeepSeek reports persistent KV cache near one eighth of V4-Flash's footprint for this design, with a small amount of additional prefill recomputation. These are architecture and deployment results, not an eightfold throughput promise. (DeepSeek technical report, September 2026)
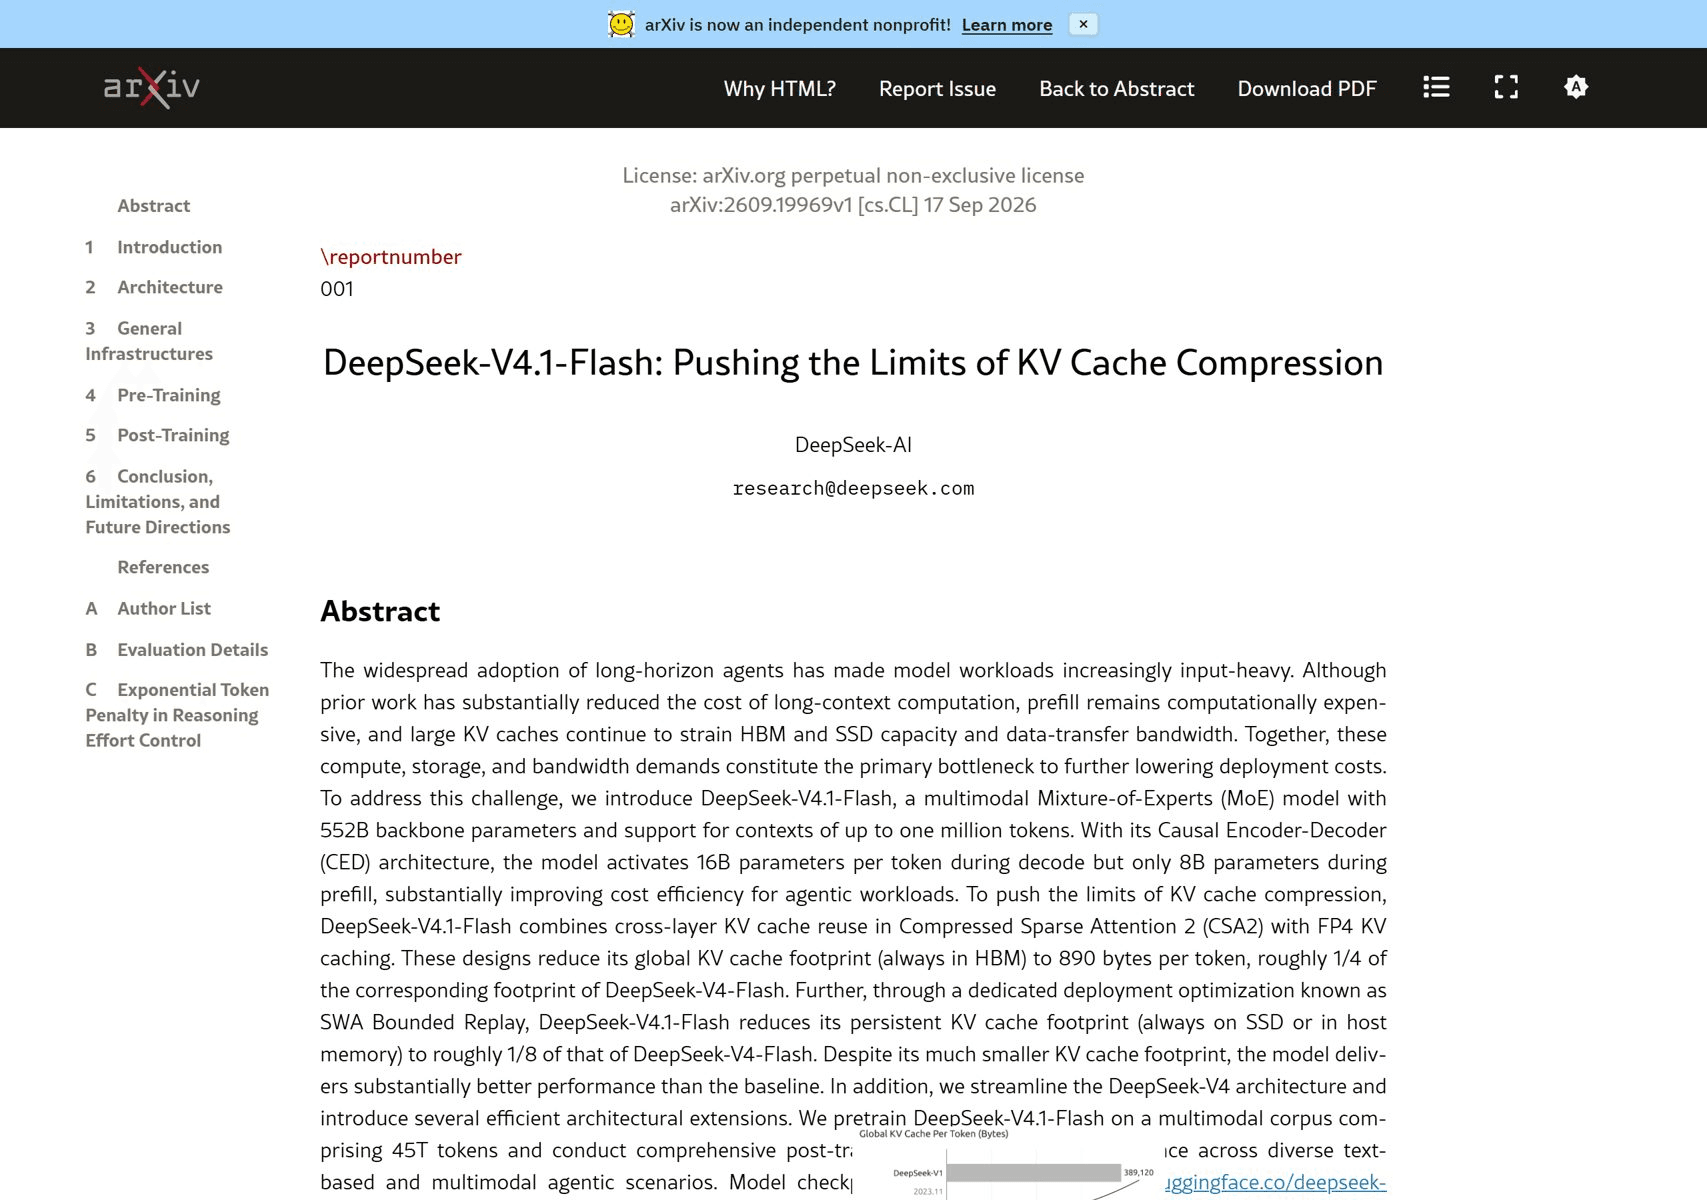
The source figure describes cache capacity, not an end-to-end throughput multiplier for every deployment.
When the diagnosis is unclear, profile one representative run and inspect queue time, GPU utilization, memory use, and per-stage timing. Change one variable, rerun the same workload, and check output correctness or task quality. This keeps an apparent speedup from masking a regression in service or answers.
Tune vLLM or SGLang Against the Same Target
Choose a runtime whose current model path supports the checkpoint and hardware you intend to deploy. Verify the exact release, kernels, graph behavior, and parallel layout. A model being listed as supported does not mean every quantization or topology is equally optimized.
vLLM: validate the release-specific model path
The vLLM team's October report describes a progression on its AgentX benchmark: about 1.9× improvement in its low-latency result and about 5.3× throughput under a 150 TPS constraint versus its day-zero baseline. The work included SWA bounded replay with CUDA graphs and model-specific kernel integration. Treat those values as evidence that the stack changed materially over time under that benchmark, not as multipliers to apply to another cluster. ( vLLM engineering report, October 2026)
For your run, establish a supported release and known-good configuration first. Then measure graph capture or replay behavior, batching, and parallelism individually. Preserve the latency constraint used to select a higher-throughput point. If graph capture changes startup or memory needs, include those costs in the deployment decision.
SGLang: match its concurrency profile
The SGLang team's report gives an unusually clear example of why test context matters. On 8 H200 GPUs, its optimized run without speculative decoding rose from roughly 76 to 168 tokens/s per user at concurrency one, and from about 96 to 221 output tokens/s per GPU at concurrency 64. It used fixed 8,192-token inputs and 1,024-token outputs. Its separate 4×GB300 results used different prompt lengths, parallel settings, and DSpark speculative decoding. The report therefore supports evaluating SGLang's optimizations on your traffic, not ranking it directly against the vLLM AgentX numbers. ( LMSYS/SGLang optimization report, September 2026)
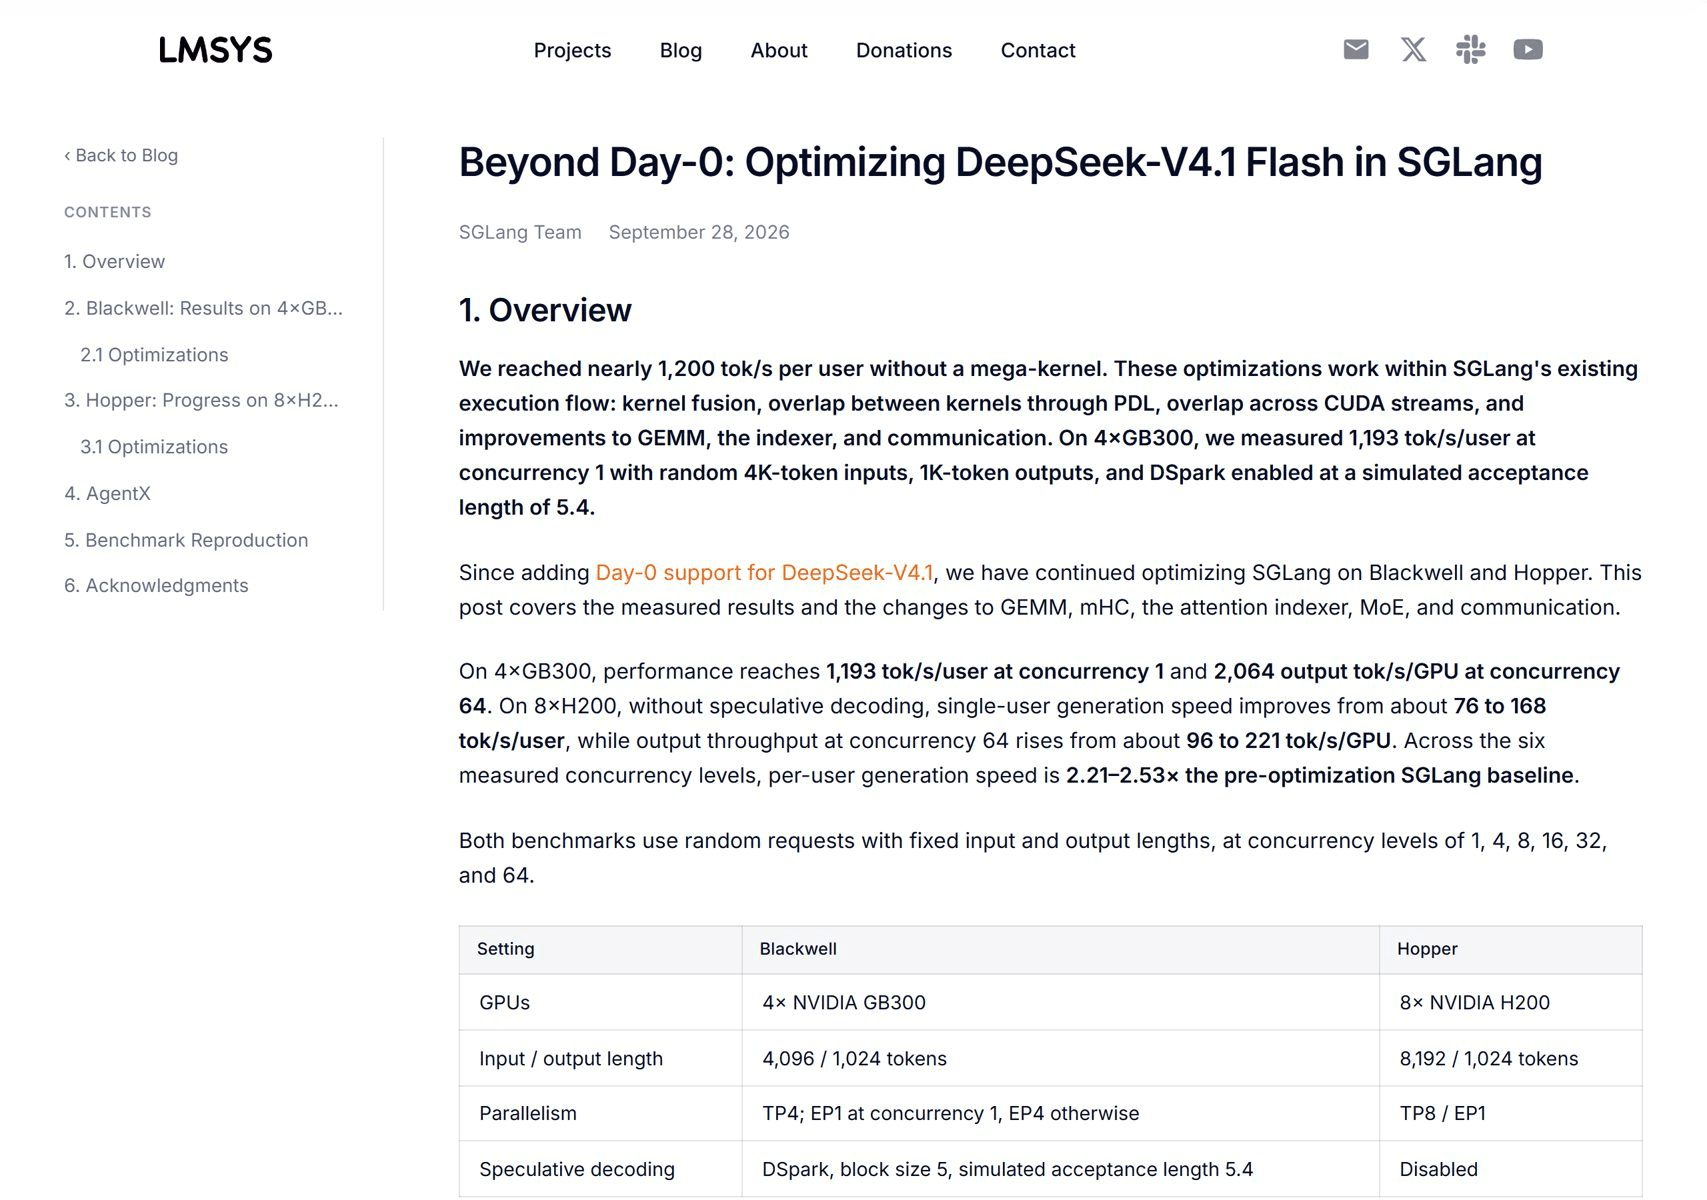
The source reports use different workloads and hardware; their numbers should not be read as a head-to-head chart.
Start with one runtime and optimize its supported path. Only build a second runtime comparison if you can hold checkpoint, GPU allocation, prompt and output distributions, concurrency, warm-up, and service objective constant. That comparison costs engineering time, so first confirm the current stack is actually the limiting factor.
Optimize Concurrency and Long Context Without Breaking the SLO
Increase concurrency in steps and capture aggregate output, per-request decode speed, TTFT, p95 latency, memory use, and failures at every step. Keep the highest-throughput point only if its latency and error rates still satisfy your service objective. If requests queue before generation, a bigger batch may improve device utilization while making the product feel slower.
For long-context traffic, measure the active context distribution and cache hit rate. A stated maximum context window does not mean every request can be served concurrently at that length. KV cache competes for memory with weights, activations, graph pools, and runtime buffers. Leave headroom for variable request lengths and measure eviction or preemption under realistic traffic.
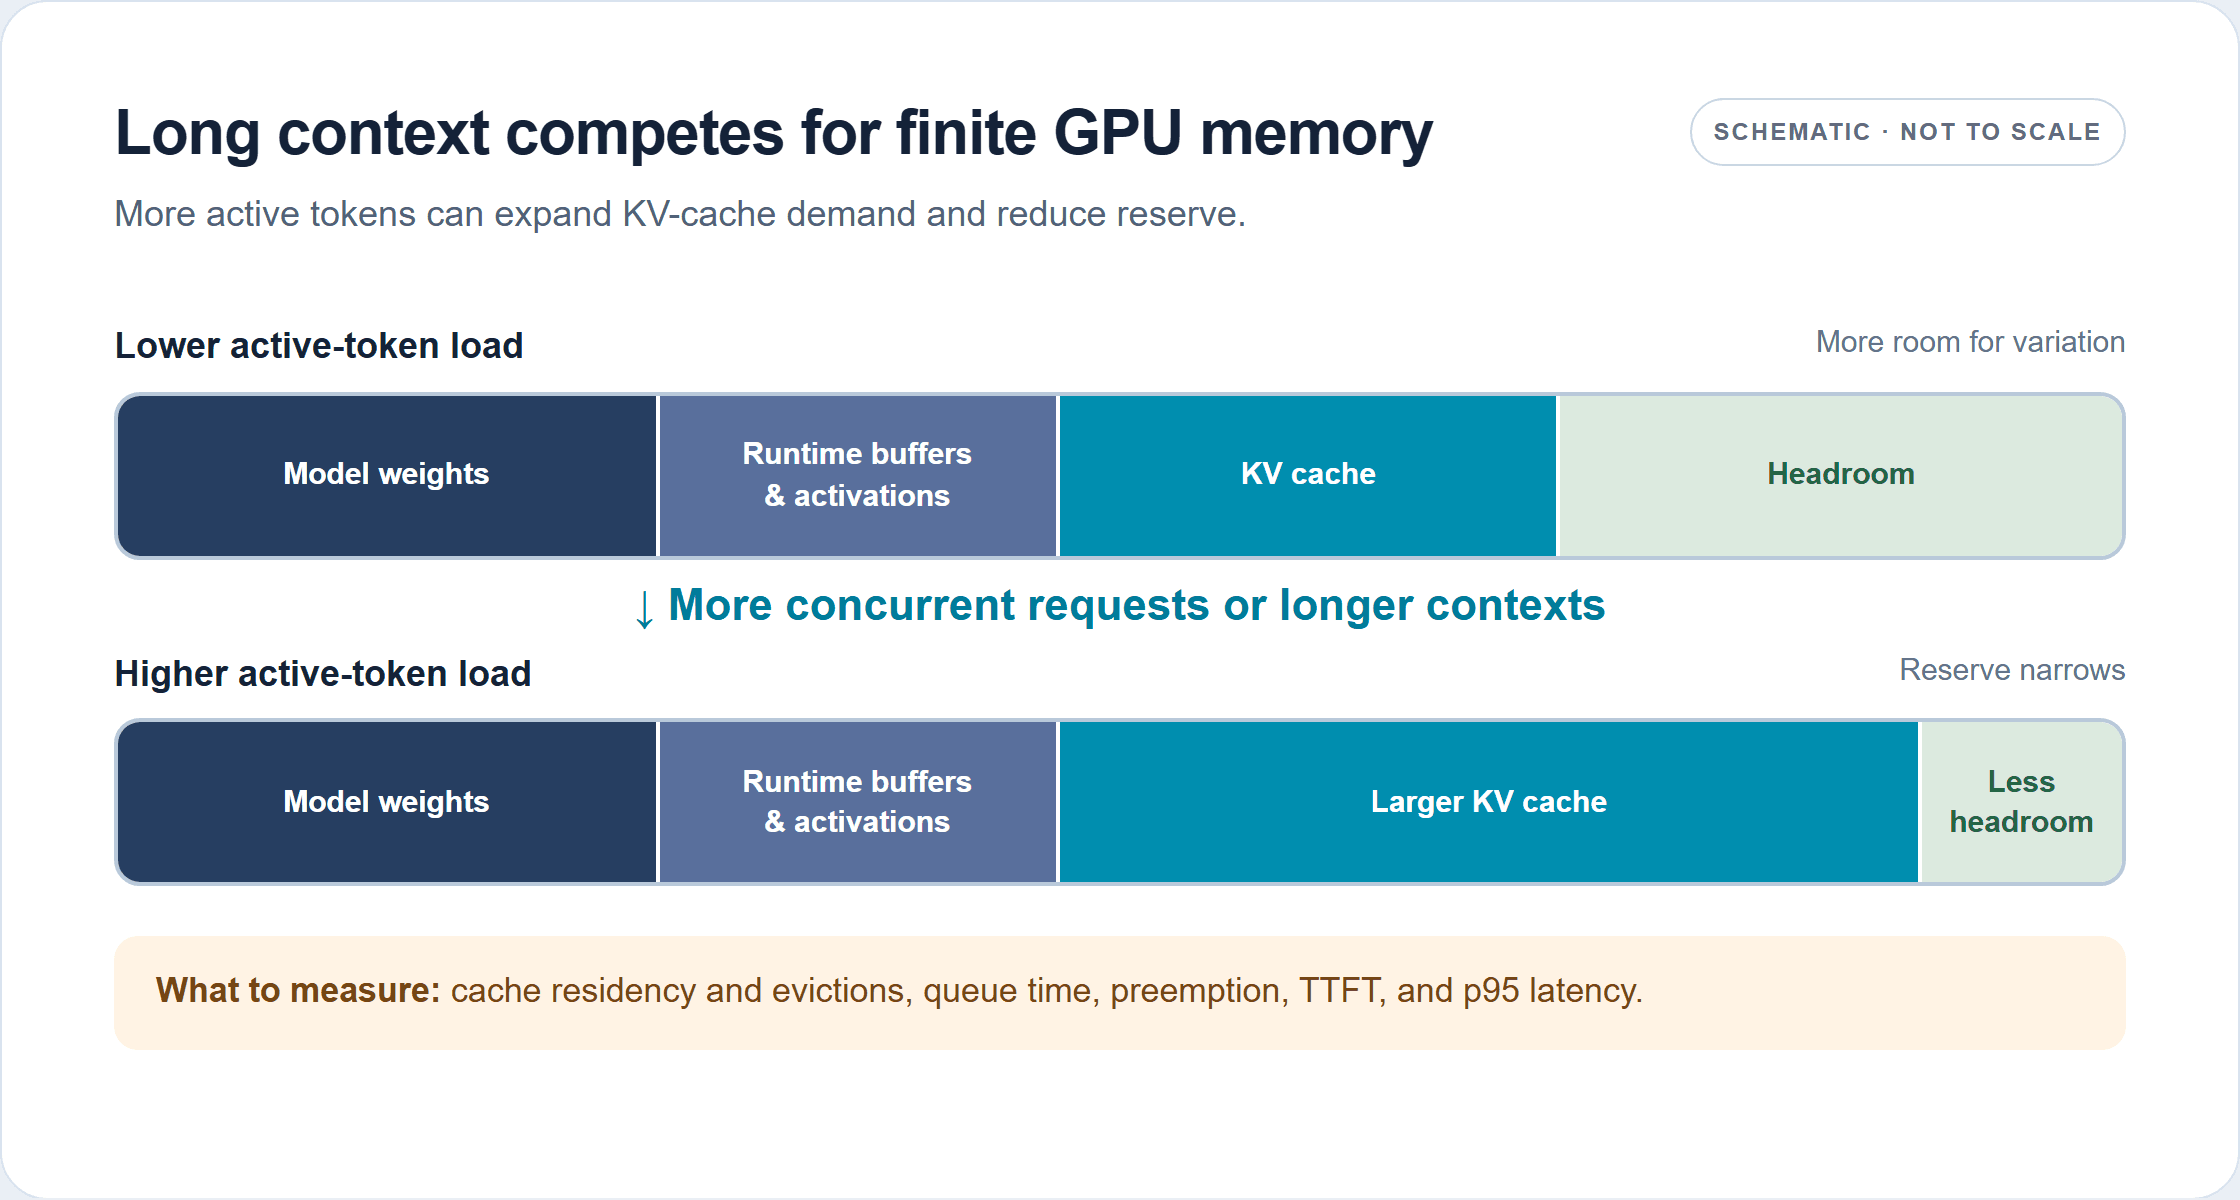
Longer contexts or more concurrent requests can increase KV-cache demand. The memory blocks are schematic and not to scale.
Treat quantization, KV-cache precision, tensor parallelism, expert parallelism, and prefill/decode disaggregation as separate experiments. They can change memory use, communication, kernel selection, output quality, and latency. The best layout depends on GPU type and interconnect; adding more GPUs can raise communication costs or leave some resources idle. Verify exact output quality and failure modes after changing precision or model execution.
The practical sequence is simple: reproduce the baseline, identify the metric that misses its target, form one bottleneck hypothesis, change one setting, and repeat. If the setting improves one metric while harming another, decide explicitly whether that trade-off fits the product. This makes optimization a controlled decision instead of a pile of flags.
Validate Speculative Decoding and Every Claimed Speedup
Speculative decoding can reduce serial target-model work when draft tokens are accepted efficiently and the runtime implements verification well. Its benefit depends on the draft path, acceptance behavior, batch shape, hardware, and prompt/output mix. It may help decode-bound traffic and have little value when prefill, queueing, or communication dominates.
Run an A/B test with speculation enabled and disabled. Keep the model checkpoint, prompt set, token cap, arrival pattern, concurrency, warm-up, and measurement window fixed. Record accepted tokens per verification step if available, alongside aggregate throughput, per-request speed, TTFT, p95 latency, GPU use, failures, and task quality. A simulated acceptance length in a published benchmark is a test condition, not a value to assume for your prompts.
A claimed speedup is useful only if it survives three checks: the same service objective, acceptable answer quality, and a fair cost comparison. Report the full context with any number you publish. Avoid comparing different GPU counts, prompt lengths, output lengths, precision modes, model revisions, or metrics as if they were a controlled experiment.
Self-Host or Use a Managed DeepSeek V4.1 Flash API?
Self-hosting makes sense when traffic is stable enough to keep the GPUs useful, the team can operate inference infrastructure, and control over hardware or execution justifies the operational work. Include the full cost of accelerators, capacity headroom, power, networking, storage, maintenance, and engineering time. A high peak tokens/s result alone does not establish lower cost per successful task.
A managed API is useful when a team needs to validate product demand quickly, avoid running a serving fleet, or compare an API baseline with its own deployment. Atlas Cloud lists DeepSeek V4.1 Flash under the model ID deepseek-ai/deepseek-v4.1-flash with an OpenAI-compatible API. The DeepSeek V4.1 Flash model page currently shows $0.30 per million input tokens, $1.20 per million output tokens, and $0.03 per million cache-read tokens, with no discount displayed as of October 2026. Check the current pricing listing before estimating spend. A managed endpoint does not remove the need to measure your own request latency or traffic economics.
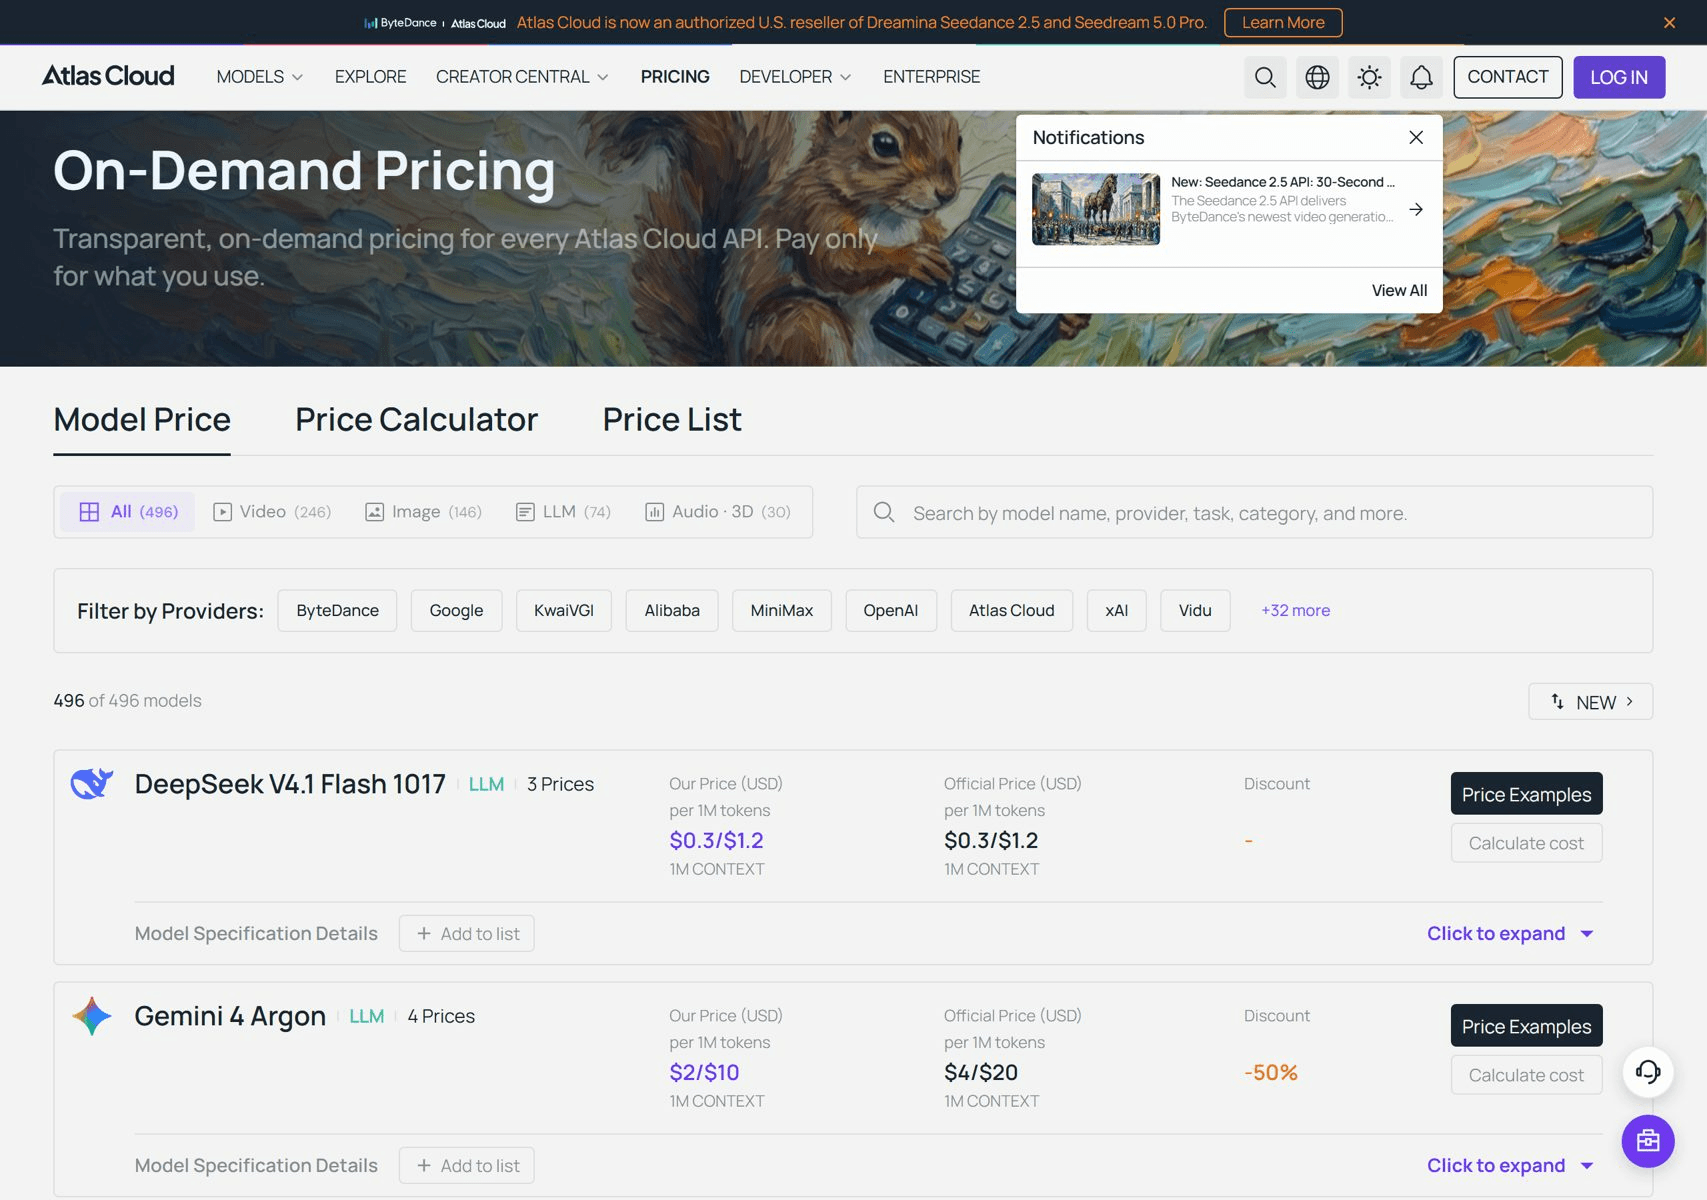
The listing identifies a managed API option; it is not a serving benchmark.
For a fair deployment decision, replay the same business requests against the self-hosted service and the managed endpoint. Compare cost per completed task, latency distribution, reliability, and the staff time needed to maintain each option. If your primary goal is DeepSeek V4.1 Flash inference throughput optimization, keep the same workload and success criteria for both paths.
Frequently Asked Questions
What is the difference between throughput and tokens per second per user?
Aggregate throughput counts output across active requests. Per-user tokens/s measures one request's decode rate. Batching can increase the first while reducing the second, so report both for interactive services.
Does increasing concurrency always improve throughput?
No. Aggregate output may rise until compute or memory saturates, then flatten. Queueing and tail latency can keep worsening after that point. Stop increasing concurrency when the service objective fails.
Can vLLM and SGLang benchmark numbers be compared directly?
Only if the model revision, hardware, prompt and output lengths, concurrency, warm state, measurement boundary, and latency constraint match. Published reports use different setups, so they demonstrate optimization paths rather than a direct runtime winner.
When should I use a managed API instead of self-hosting?
Use a managed API when speed of integration and reduced infrastructure work matter more than owning the serving stack. Self-host when utilization, operational expertise, control, and a measured total-cost case justify running the GPUs.


