Ask AI for a summary
A researcher receives a crisp 4K mechanism diagram, enlarges it, and notices that an arrow runs opposite to the method described in the manuscript. MiniMax H3 Image Research Paper Illustrations can speed up an explanatory figure draft, but resolution says nothing about whether its scientific relationships are right. Authors must check each label, connection, and claim against a source. Data plots need traceable data and reproducible methods; primary research images must come from the research. The target journal decides what AI assistance it permits.
Key takeaways
- Use MiniMax H3 Image to explore explanatory diagrams, then verify and edit every scientific detail.
- Build plots from real data and preserve original observations; never present generated pixels as experimental evidence.
- Check the journal's figure category, disclosure rules, and export specifications before submission.
- Compare models with the same brief and an itemized audit, not a visual impression.
What Is MiniMax H3 Image, and What Does It Generate?
The MiniMax H3 Image model was released on November 11, 2026, as an open-weight model for still-image generation and editing. It accepts a text description, can use reference images, and supports up to 16 references. Its published options include 1K, 2K, and 4K output areas, plus several aspect ratios and PNG output. These are useful controls for drafting a wide, legible explanatory figure; they do not certify that its labels or relationships are correct (MiniMax release announcement, November 2026).
The 16-reference limit is a capacity, not a recommendation to upload 16 unrelated figures. A researcher might supply an approved layout and a licensed icon sheet, but each extra reference can introduce conflicting visual instructions or material whose reuse rights are unclear. For the first draft below, start with text alone. Use a reference only after the scientific content in that reference has been checked.
The official MiniMax H3 Image repository documents a roughly 16-megapixel image model, text-to-image and image-editing tasks, its architecture, and a community license. Open weights allow some local or hosted use under that license; they do not mean every commercial use is unrestricted. Inspect the actual terms before publishing or deploying a service.
MiniMax H3 Image vs MiniMax video models
The names are close enough to cause an expensive mistake. MiniMax H3 Image generates or edits static images. MiniMax video entries that say text-to-video or image-to-video produce motion. A video playground screenshot cannot demonstrate a MiniMax H3 Image research figure. Confirm both the model name and task before you compare results, prices, or prompt controls.
For paper work, the model's practical appeal is the ability to request a large image with a structured layout, short labels, and a reference-guided revision. The author still owns the harder step: deciding which visible elements are evidence, which are explanation, and what each arrow means.
Which Research Paper Illustrations Are Suitable for AI Drafting?
Classify the figure by what it asks the reader to believe. A conceptual pathway diagram explains an interpretation. A chart reports measurements. A micrograph records an observation. Those roles create different obligations, even if all three look polished in a PDF.
| Figure type | What it claims | Suitable role for MiniMax H3 Image | What the author must retain or check |
|---|---|---|---|
| Explanatory concept or method schematic | A source-backed relationship or sequence | Possible visual draft, subject to venue rules | Exact labels, connections, provenance, disclosure |
| Data plot or heatmap | Values derived from a dataset | No invented chart pixels; use a reproducible plotting workflow | Raw data, code, analysis method, units |
| Primary research image | An actual observation or experiment | Do not create or alter it as if observed | Original capture and approved processing record |
| Graphical abstract | Visual summary for a journal | Check that journal's specific tool policy first | Tool permission, rights, caption, disclosure |
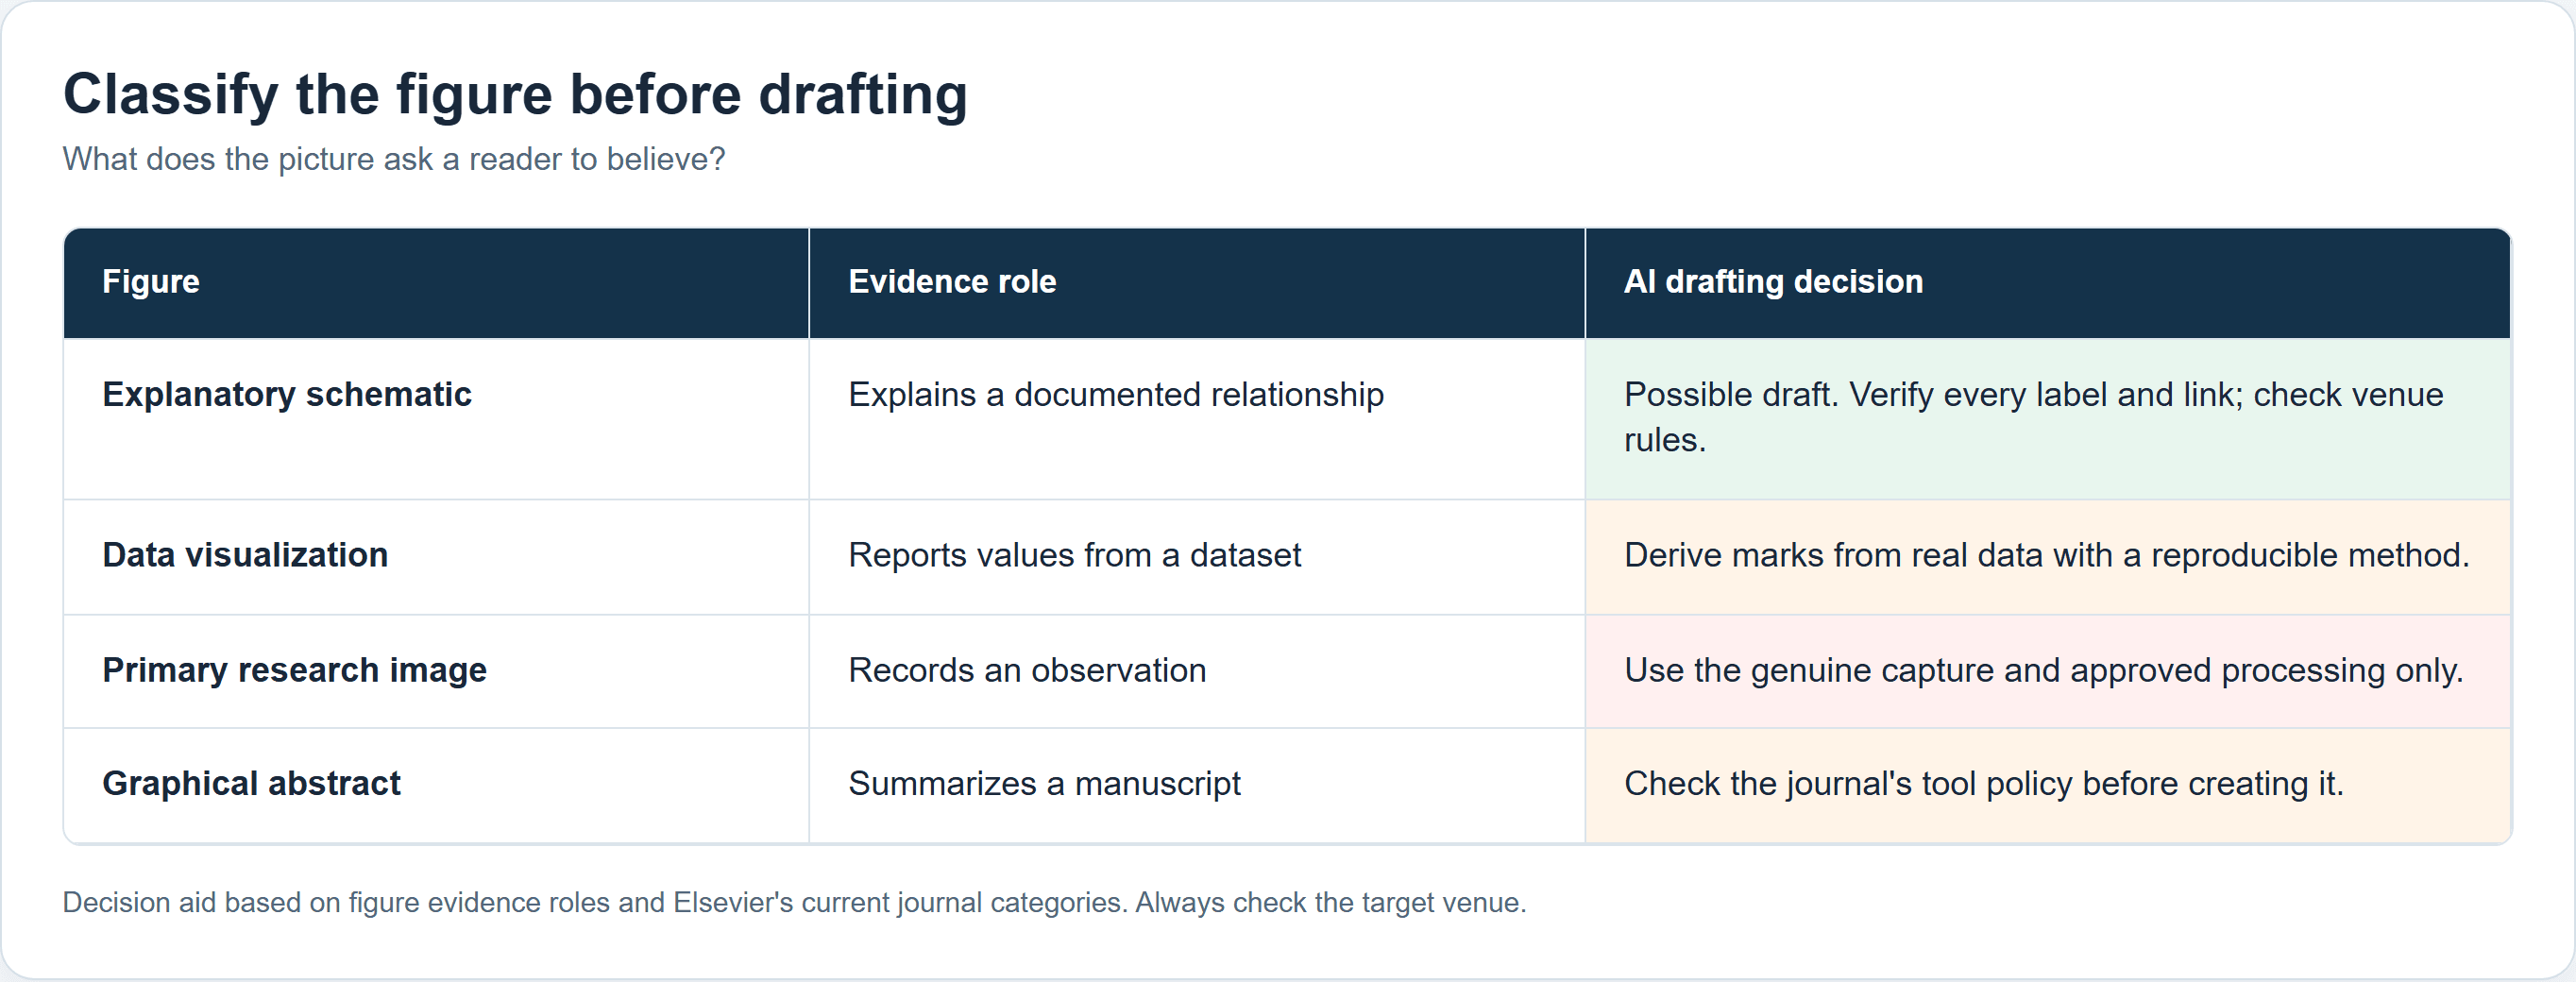
The decision table turns the figure's evidence role into a drafting choice; the accessible table above remains the source of its text.
Explanatory figures
An explanatory illustration may show the parts of a published model, a proposed mechanism, or a documented workflow. It should say what it explains and avoid implying that the picture itself demonstrates an experimental result. Elsevier's current journal policy allows AI tools to support certain explanatory images with human oversight and disclosure in both the image caption and the article. That is a publisher-specific example, not universal permission (Elsevier generative AI policies for journals, accessed November 2026).
Data and primary research images
If a figure asserts measured values, calculate its marks from the underlying dataset with a reproducible plotting method. A generated bar chart can add a convincing axis while quietly changing values or units. Keep the data, plotting code, statistical method, and figure version together. For microscopy, scans, gels, or similar observations, preserve the actual capture and follow the venue's accepted processing rules. A text-to-image model cannot create a new observation.
Graphical abstracts
A graphical abstract may be a visual summary, yet its rules can differ from ordinary explanatory figures. Elsevier currently says general-purpose generative image tools must not create graphical abstracts and points authors toward dedicated scientific illustration tools. Another institution or journal may set different terms. Decide the destination before commissioning the art.
How to Prompt MiniMax H3 Image for an Explanatory Figure
A useful figure prompt begins as a small, source-backed specification. The example here depicts the published MiniMax H3 Image architecture itself. MiniMax says the text prompt and reference images pass through a text encoder, reference images also pass through an image VAE, a single-stream transformer predicts the target latent, and a VAE decodes it. Those relationships come from the repository's architecture section. The simplified prompt below is a teaching brief, not a claim that a MiniMax H3 Image run has already passed review.
Write the source-backed brief
Before opening a generator, make a two-column list: required objects and required connections. For this architecture, the objects include the text prompt, reference images, text encoder, image VAE, single-stream diffusion transformer, image VAE decoder, and generated image. Record where each input enters. If the repository changes, update this list before revising the picture. Keep implementation details out of the figure unless the manuscript actually discusses them.
Use MiniMax H3 Image's text-to-image mode. Request one PNG, a landscape 16:9 canvas, and 4K output area if that interface exposes those controls. If it offers only a different size or ratio, record the controls it actually accepts and adjust the figure brief. Paste this complete prompt:
plaintext1Create a clean explanatory figure for a technical article about the published MiniMax H3 Image architecture. Landscape 16:9, white background, three left-to-right stages, readable at print size. Stage 1: two inputs labelled exactly "Text prompt" and "Reference images". Stage 2: show "text encoder" receiving the text prompt and reference images; also show "Image VAE" receiving the reference images. Connect their encoded representations to one central box labelled exactly "Single-stream diffusion transformer". Stage 3: connect that box to an "Image VAE decoder" and then an output labelled "Generated image". Use only these labels. Use solid arrows to show information flow; no extra components, performance numbers, charts, experimental results, or invented citations. This is a conceptual explanation, not a measured result.
Fix labels and layout
Treat the output as a candidate. First compare every box and arrow with the source-backed list. Then check text at the size the journal will print, including hyphens, capitalization, and whether arrows touch the intended boxes. Correct the figure in an editable drawing tool if any relationship is ambiguous. Re-prompting alone is a weak repair for a scientific error because a new image can silently change another connection.
Five MiniMax H3 Image Examples: What the Picture and Prompt Actually Show
The official MiniMax H3 Image showcase publishes these outputs beside their source prompts. The images below are those published examples, not results generated for this article. Each shorter prompt is an adaptation for a reader's own test, not the exact prompt that produced the pictured output; MiniMax publishes the full original prompts in its official showcase. Judge each image against the source material before treating it as a research figure.
Case 1: Turn a synthetic biology brief into a three-panel figure
MiniMax supplied a one-page synthetic study about seedlings bending toward unilateral 470 nm blue light. The original biology prompt asks for a setup panel, an initial-versus-final comparison, and a time-versus-angle plot. The source specifies four invented pairs: 0, 2, 4, and 6 hours at 0, 10, 25, and 40 degrees. The published output includes all three panels and retains the synthetic-study label. This is a much closer paper-figure example than a generic product exploded view.
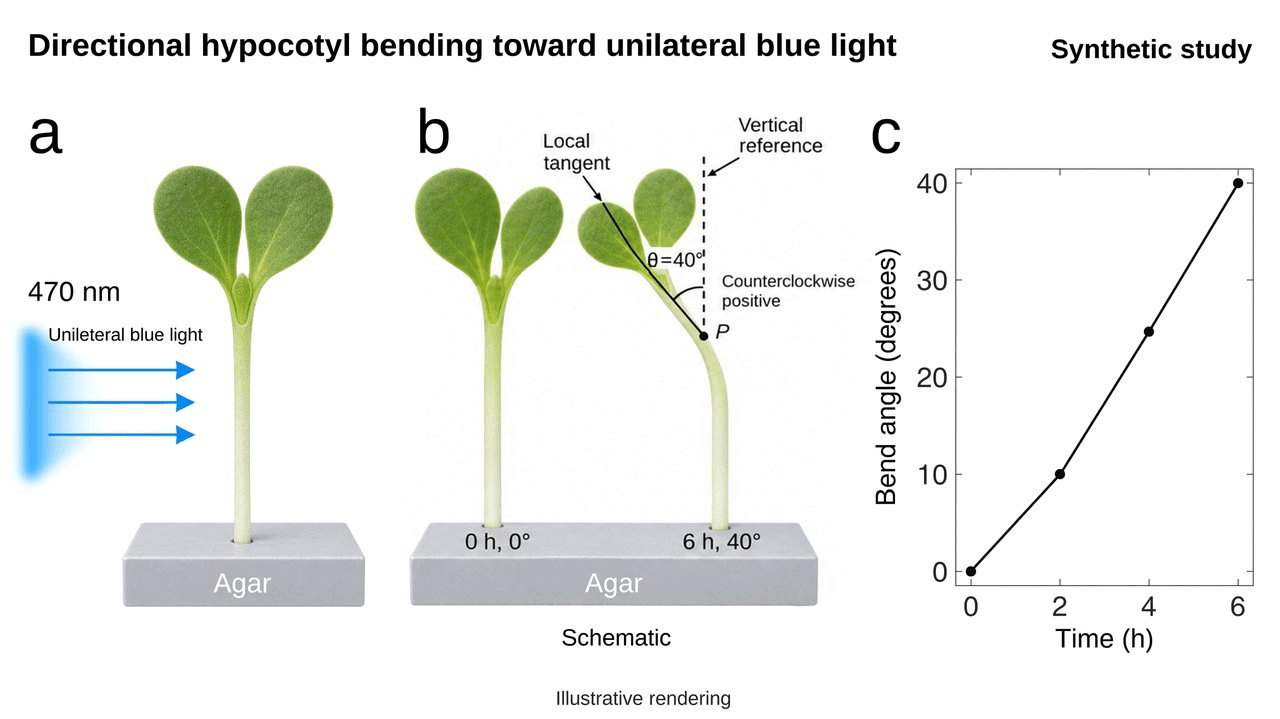
Official MiniMax H3 Image showcase output for a synthetic study. The source is an invented benchmark page, not published experimental data; compare the four plotted values and the light direction with the source page before reuse.
Adapted prompt to try:
plaintext1From the attached synthetic seedling-study page, make one 16:9, three-panel biology figure on white. Panel a shows the fixed left-side 470 nm blue-light source, seedling, agar and left-to-right light arrows. Panel b compares 0 h and 6 h shapes; define the 40-degree final bend from the local tangent to vertical. Panel c plots only the stated time-angle pairs (0, 0), (2, 10), (4, 25), (6, 40), with axes and units. Label the work "Synthetic study" and the drawings "Schematic" or "Illustrative rendering". Add no controls, error bars or conclusions absent from the page.
Audit: Verify that the curve plots exactly four source values and that the depicted shoot bends toward the light. Even a visually complete output is not evidence that an experiment occurred.
Case 2: Explain a two-mirror optics setup without presenting it as measured evidence
The original prompt for MiniMax's corner-mirrors example asks for two perpendicular mirrors, a small station model, single reflections in each side mirror, and a double reflection at the corner. The generated picture resembles a photograph of a physical demonstration, yet it is a synthetic illustration. In a paper, it could explain the intended viewing geometry; it could not stand in for a photograph of an experiment that was actually conducted.
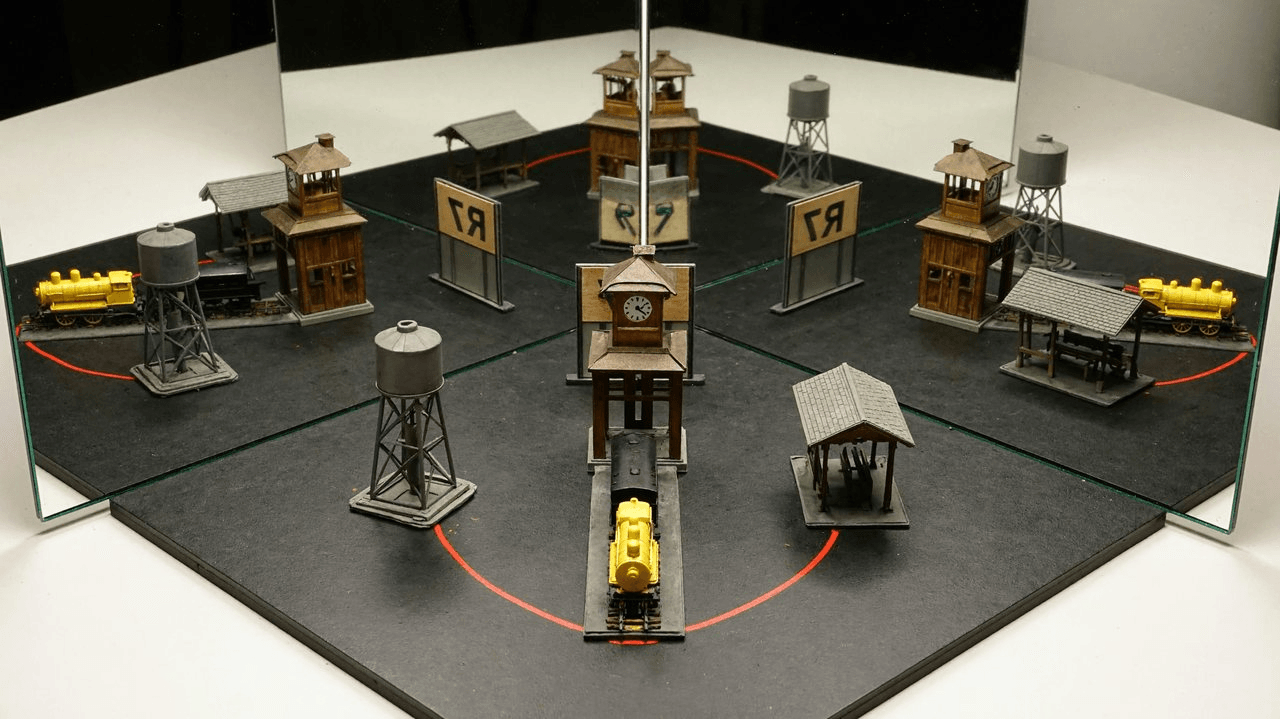
Official MiniMax H3 Image showcase output. Treat this as a generated optics illustration, not primary experimental evidence. Check each reflected object's orientation against the stated mirror geometry.
Adapted prompt to try:
plaintext1Illustrate a tabletop optics demonstration with two upright plane mirrors meeting at 90 degrees, their reflective faces turned inward. Place one station model in front: a clock tower at its center, a water tower on one side, a shelter on the other, a small yellow-front vehicle, and a sign marked "R7" facing the corner. Show the real model, one image in each side mirror, and a double-reflected image deeper in the corner. Keep the mirror seam visible. Reverse text and object orientation only where reflection geometry requires it. The result is a conceptual rendering, not a record of a real experiment.
Audit: Label the image as generated, then trace the sign, vehicle, water tower, and red connecting line through both reflections. If the paper reports an actual optical measurement, use the original camera capture and apparatus record instead.
Case 3: Keep robot labels and dimensions consistent across views
The original prompt for MiniMax's wheel-legged robot case specifies standing and crouching side views, a three-dimensional view, four leg IDs, and an actuator table. It gives a 500 by 360 by 180 mm body, 120 mm wheels, and a 120 mm height change. The published output includes the requested panels, but the three-dimensional view labels two legs "RR" and has no visible "FR" label. That is a concrete cross-panel consistency error, even though the actuator table lists all four IDs.
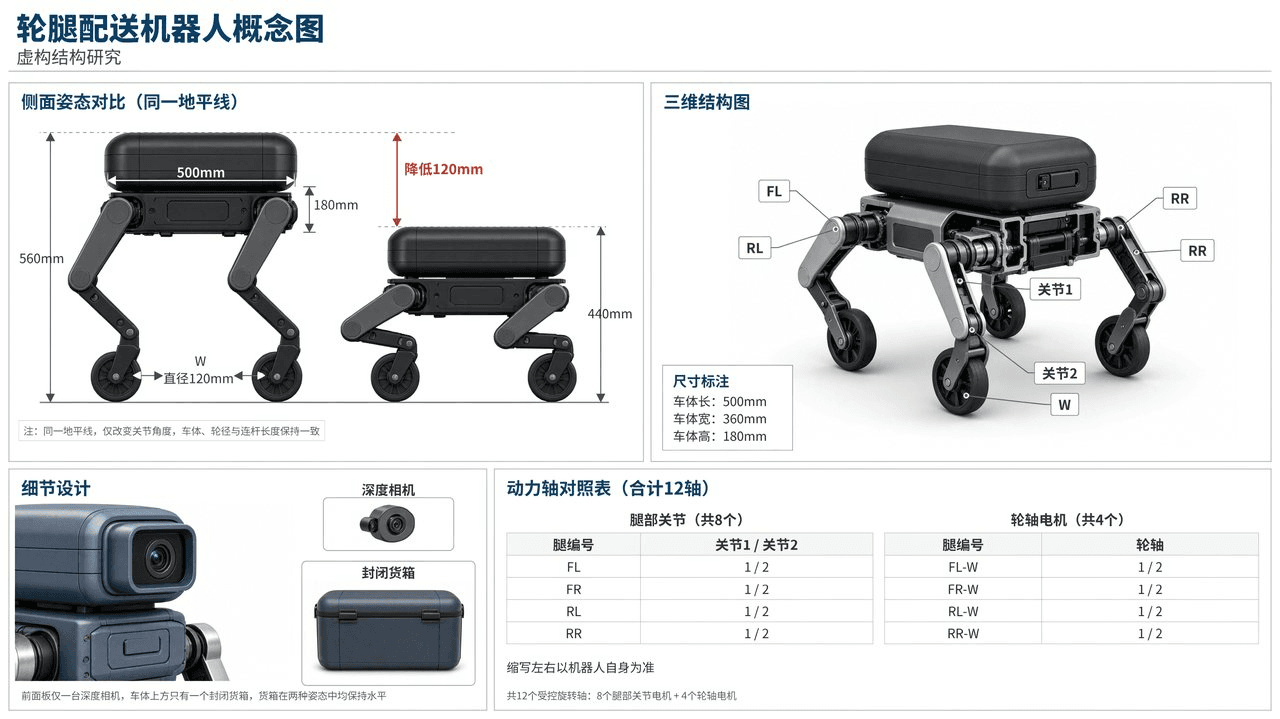
Official MiniMax showcase output for a fictional structural study. The three-dimensional view repeats "RR" and omits "FR"; check every label and quantity before adapting the concept for a manuscript.
Adapted prompt to try:
plaintext1Create a 16:9 fictional wheel-legged delivery robot concept sheet. Show the same robot standing and crouching on one ground line, plus one three-dimensional view and an actuator table. Its body is 500 mm long, 360 mm wide and 180 mm high; each of four legs has two joints and one 120 mm wheel. Mark legs FL, FR, RL and RR exactly once in the three-dimensional view. There are eight leg joints and four wheel motors, for twelve controlled rotary axes. Show body-top height changing from 560 mm to 440 mm only by joint angle; keep body, wheel sizes, camera and cargo box unchanged. Label the study fictional.
Audit: Count the four leg IDs in each view, recalculate 560 minus 440 mm, and compare the actuator table with the drawing. Do not treat generated dimensions as engineering measurements.
Case 4: Build a blueprint from two separate references
The original prompt for MiniMax's moka-pot case supplies one image of the assembled pot and another of its parts. It asks for an exploded view, a cross-section, and top and side views. The published output has the requested visual language, but its lettered dimensions have no numerical values and the internal flow path is not clearly established. For a paper, this would be a layout draft requiring a verified parts drawing and manual dimensioning.
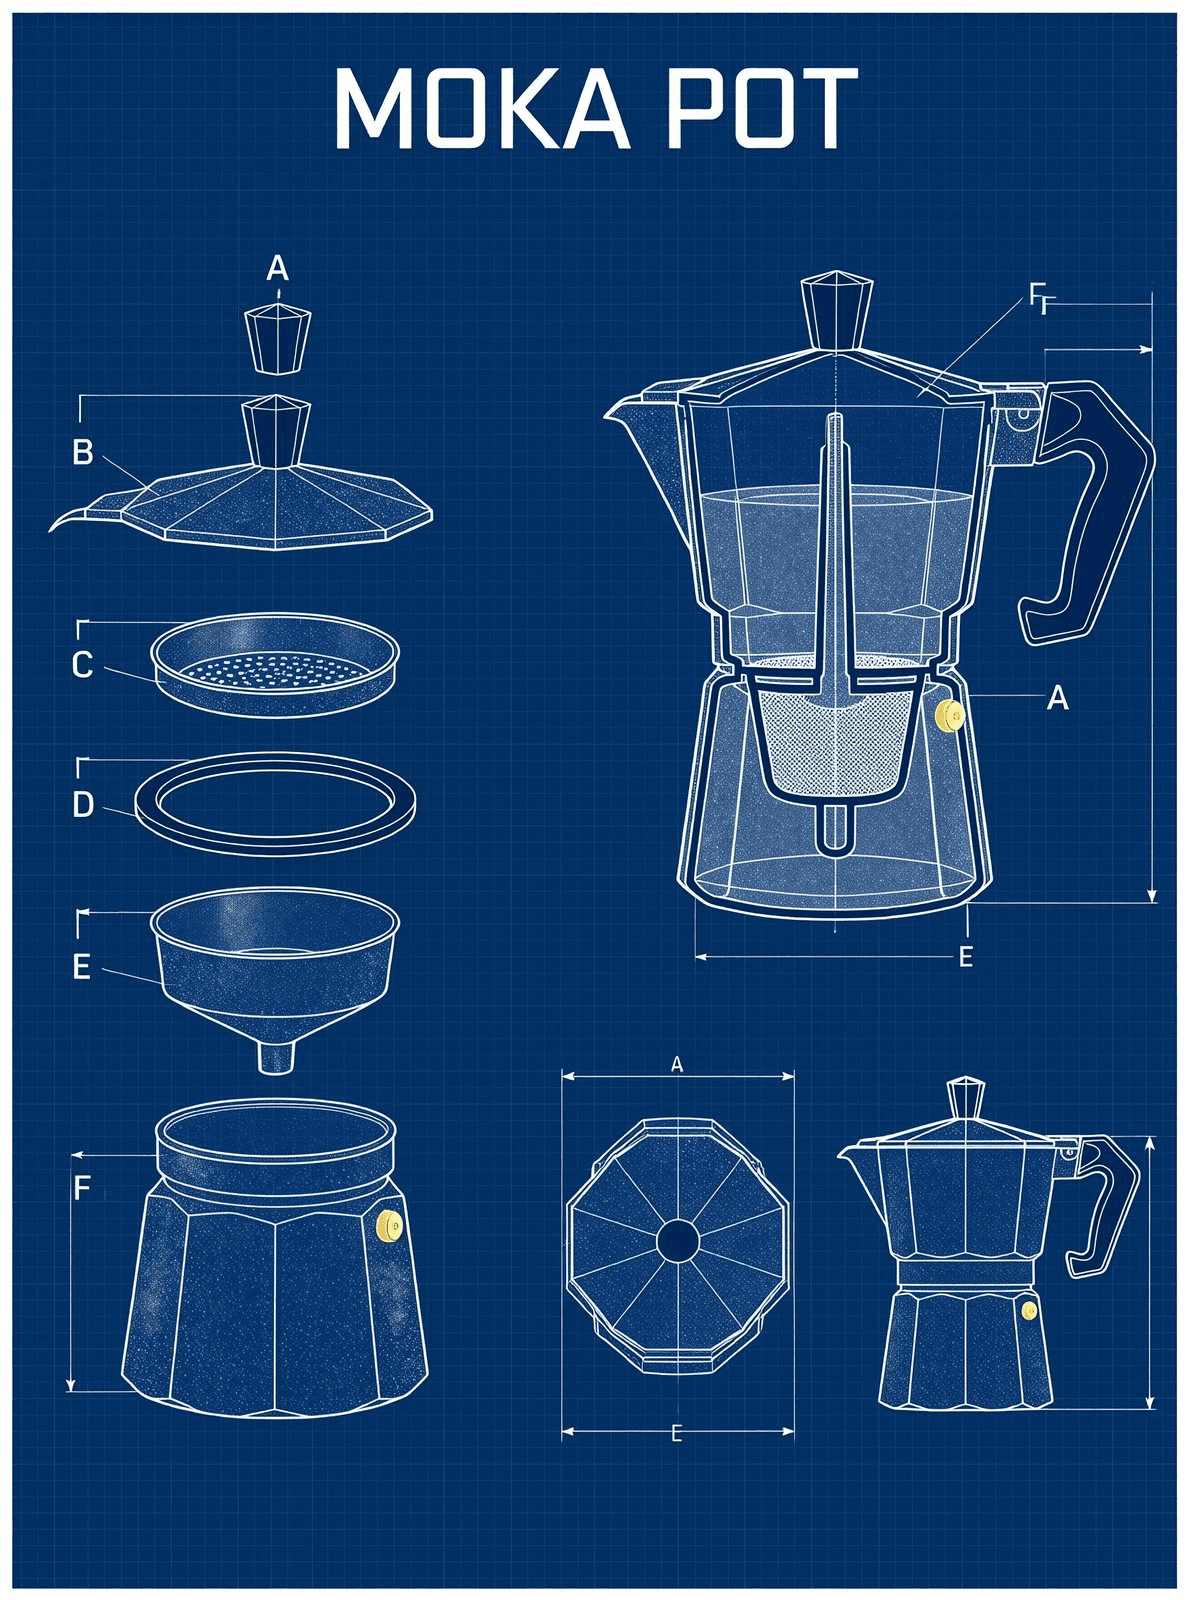
Official MiniMax showcase output from two reference images. The appearance of dimension lines does not supply measured dimensions.
Adapted prompt to try:
plaintext1Use reference image 1 for the moka pot's exterior and reference image 2 for its component order. Make a portrait blueprint study with an exploded stack on the left, a large cross-section on the upper right, and top and side views below. Preserve the lid, upper chamber, filter screen, gasket, funnel basket and lower chamber across views. Use letter markers for dimensions unless verified measurements are supplied; show no invented millimeter values. Mark any water-flow arrow only where the references establish its path.
Audit: Match the order and number of parts to the supplied reference. Add numerical dimensions later from measured drawings, not from generated geometry.
Case 5: Check whether a dimensioned concept stays consistent across panels
The original ceiling-rail courier prompt specifies stations at X = 300, 1200, and 2100 mm, a 400 mm carriage, and a 560 mm vertical stack. Its output presents an elevation, a detail, and a three-position storyboard. The prompt says the gripper holds one sealed parcel throughout, yet the storyboard's B and C panels show empty grippers. This gives a concrete, visible failure to test when one object must persist across multiple views.
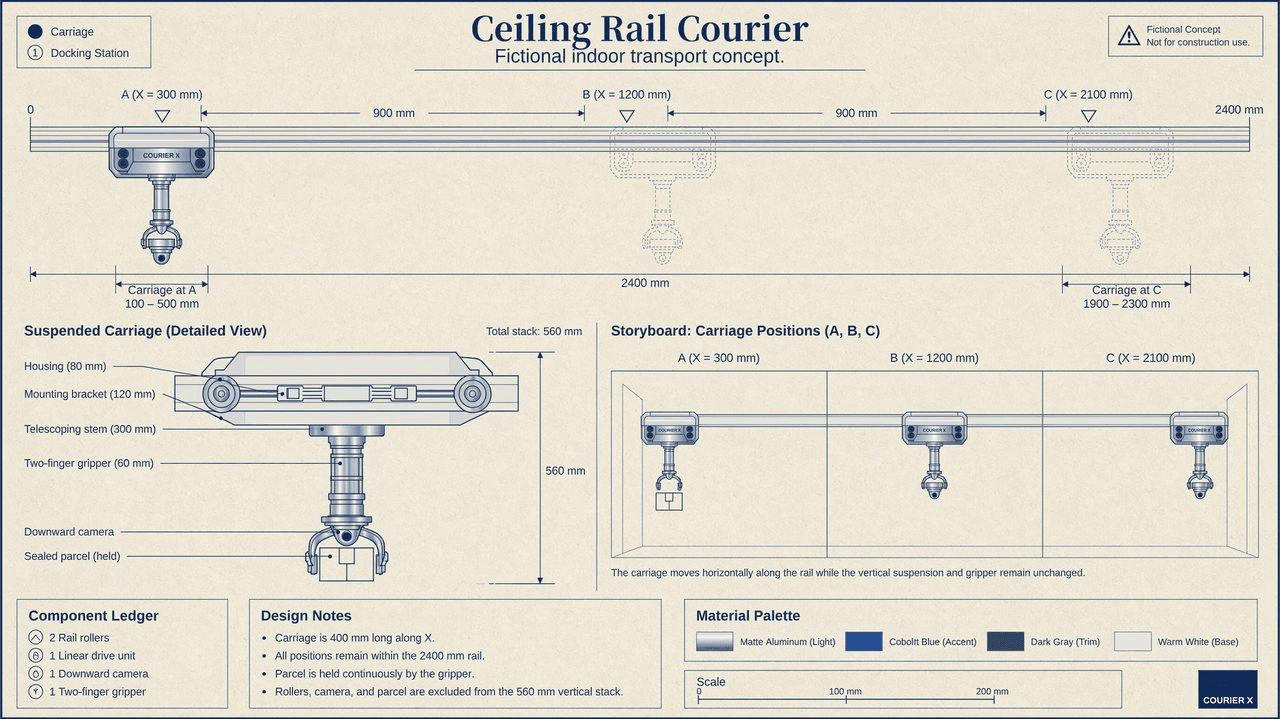
Official MiniMax showcase output. In the storyboard, the parcel appears at A but is absent at B and C, despite the prompt's persistence requirement; this is a fictional concept, not a construction drawing.
Adapted prompt to try:
plaintext1Draw a 16:9 fictional ceiling-rail courier concept sheet. Across the top show a 2400 mm rail with docking centers A = 300 mm, B = 1200 mm and C = 2100 mm. Give the carriage a 400 mm footprint. Below, show one detailed carriage and a three-panel storyboard of that same carriage at A, B and C. The 560 mm vertical stack is 80 mm housing + 120 mm bracket + 300 mm stem + 60 mm gripper. Show exactly one sealed parcel held by the gripper in every storyboard panel. Keep the roller count, camera position and component labels consistent; mark the drawing "Fictional concept".
Audit: Recalculate the dimensions and inspect all three panels for the parcel. If any state or measurement changes, correct the editable figure before citing it in a manuscript.
How to Audit Labels, Arrows, and Scientific Meaning
Scientific figures are judged by semantics and structure, not just readability. SridBench contains 1,120 scientific illustration instances across 13 disciplines and evaluates dimensions including semantic fidelity and structural accuracy. Its authors report problems with text clarity and scientific correctness among evaluated models. The benchmark did not test MiniMax H3 Image, so its numbers provide a reason to audit, not a MiniMax H3 Image score (SridBench paper, May 2025).
Run the audit at two sizes: the full exported file and the width it will occupy on the page. Invite a coauthor who did not write the prompt to check the picture against the source brief. The reviewer should explain what each arrow means without relying on the intended caption.
| Audit item | Concrete test | If it fails |
|---|---|---|
| Objects | Match every visible object to the source brief | Remove or relabel unsupported objects |
| Connections | Trace each arrow from source to destination | Redraw wrong or ambiguous arrows |
| Labels | Compare spelling, abbreviations, and case | Replace text in an editable tool |
| Numbers and units | Trace every value to data or documentation | Remove unsourced values |
| Visual hierarchy | Check reading order at print width | Rearrange panels without changing meaning |
| Caption | Describe only what the final file visibly shows | Rewrite caption after the last edit |
Keep a marked copy of the audit with the final figure. That record lets an author answer a reviewer who asks why a component was included or whether a relation came from the model. It also reveals when a late layout edit has reintroduced an error.
Where to Make the Figure: MiniMax H3 Image and a Hosted Baseline
The official documentation describes ways to run MiniMax H3 Image through its own tools or a local deployment. As of this review, the public Atlas Cloud catalog shows MiniMax video entries, while an Atlas listing for the separate MiniMax H3 Image model has not been verified. Do not choose a MiniMax video page for this task or claim a MiniMax H3 Image run on Atlas Cloud.
For a hosted comparison, Atlas Cloud lists GPT Image 2.6 Sunburst Text-to-Image. Paste the exact architecture prompt from the earlier section into that model's playground. Request quality=max, complexity=high, size=2048x1152, PNG, and one image if those settings are available. Record what the interface actually commits, the completed result, and the quoted cost for that specific run. The catalog's starting price is not the max-tier price. No completed hosted baseline is shown here, so this article makes no result or performance claim for that prompt.
Use the same checklist for both candidates: count labels, trace arrows, check unsupported content, and time the human correction needed. A visually tidy result may require more repairs than a plain one. If MiniMax H3 Image is unavailable in your chosen environment, the hosted run remains a baseline for the brief rather than a model-to-model verdict. Check current pricing in the model page or playground before generating; avoid carrying a displayed entry price into a budget estimate for different settings.
Before Submission: Policy, Disclosure, and Export Checks
Begin with the target journal's current author instructions, then its publisher policy. Confirm that the venue accepts AI assistance for this figure category, what counts as disclosure, and whether the caption must name the tool and version. Check the rights for every reference image you uploaded and for the model output. A publisher policy can change, and a particular journal may impose tighter rules.
Preserve a small figure record: the source-backed brief, source documents, exact prompt, settings, generated draft, checked revisions, final file, and the human reviewer who approved each scientific relationship. For a data plot, add the dataset, code, analysis version, and units. For an observational image, retain the original capture and processing log. These records make the final figure easier to defend than a prompt alone.
Before export, inspect the accepted file format, physical column width, text size, and minimum resolution. Export a PNG or another format the venue requests, then open the exported file itself. Make sure fine arrows survive scaling and that the caption describes the final image, not an earlier draft.
A disclosure sentence to adapt is: “During preparation of Figure X, the authors used MiniMax H3 Image [version or access date] to draft an explanatory layout; the authors checked and revised all labels and connections against [source] and take responsibility for the final figure.” Put this where the target venue requires it, and add any caption-level statement it asks for. Do not imply that a human redrawing automatically removes a disclosure obligation.
For MiniMax H3 Image Research Paper Illustrations, the practical next step is to classify the figure, write a source-backed brief, produce one candidate, and audit it at print size. Submit only after the journal's category and disclosure requirements are satisfied.
Frequently Asked Questions
Can I use an AI-drafted conceptual figure in a thesis if I am not submitting to a journal?
Check your graduate school, department, and supervisor's current rules. A thesis may have its own disclosure and image-rights requirements, even when no journal is involved. Keep the same source brief and revision record so an examiner can see what you verified.
Should I disclose a MiniMax H3 Image draft that I redrew manually?
Check how your institution or venue defines AI-assisted figure preparation. Manual redrawing changes the final pixels, but it does not erase the role the generated draft played in planning the composition. Describe that role accurately under the applicable rule.
Does open-weight access mean unrestricted commercial publication rights?
No blanket permission follows from open weights. Read the current community license for MiniMax H3 Image, including its commercial terms and acceptable-use provisions, and check any rights attached to your reference images. Seek a specific rights review when the planned use depends on an exception.
Can MiniMax H3 Image make a chart from my study's numerical results?
Use the dataset and reproducible plotting code to place every mark, axis, and uncertainty interval. MiniMax H3 Image can help explore a surrounding explanatory layout if the venue permits it, but a generated chart image is not a traceable rendering of the data. Keep the data, code, analysis version, and final plot together.
Is a 4K MiniMax H3 Image export automatically suitable for journal submission?
No. The journal's required file type, physical figure width, resolution, and minimum readable text size determine suitability. Open the exported file at its intended print width and inspect labels, line weights, arrows, and panel letters. A large pixel count cannot correct a wrong relationship or illegible annotation.